33 features, each with what it does, how to use it and a screenshot from the demo (sample data, so no real sites). Every section can open the same screen in the live demo.
Sign in with the Google account that can see your sites in Search Console. RankSlide asks for read-only access, so it can never change anything in Search Console or on a website.
1Click Start free trial and sign in with Google. No card is needed for the 14-day trial.
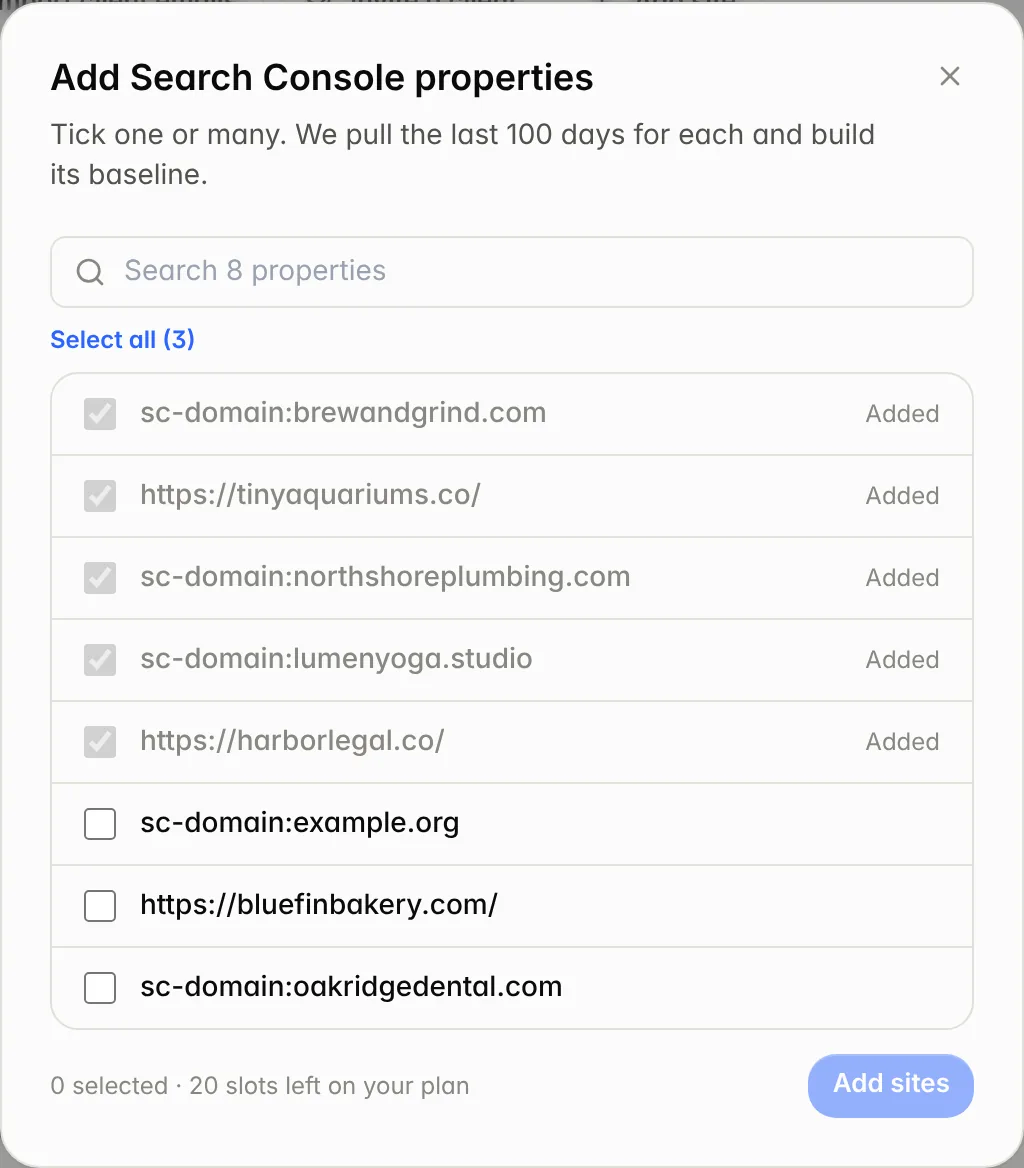
2Click Add site. Every property your Google account can see is listed.
3Tick one site or many (Select all works too) and click Add sites.
4The first sync pulls the last 100 days of page and search data, plus 16 months of daily totals for year-over-year comparisons, and takes about two minutes per site. After that, every site syncs each morning.
Sites already added are greyed out, and the dialog shows how many slots your plan has left.
Search Console data arrives about 2 days late, so “today” in RankSlide is always the latest day Google has finished.
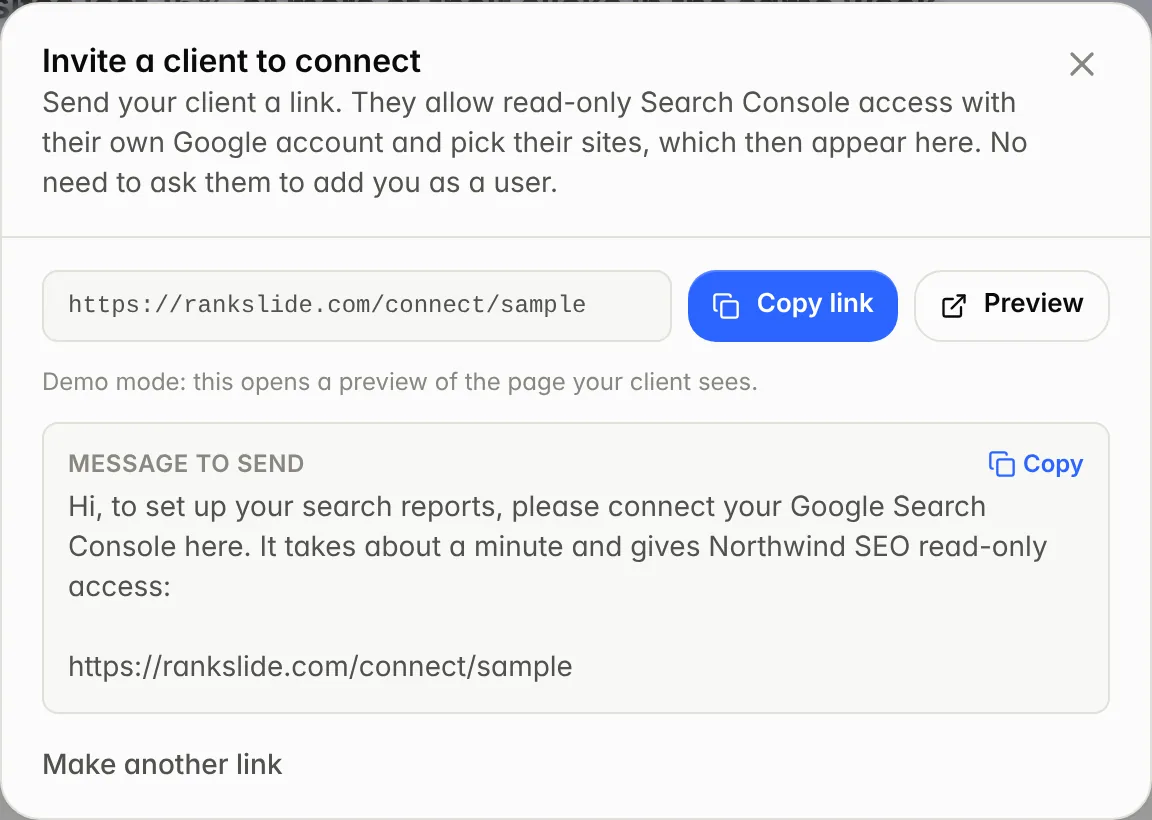
No need to ask each client to add you as a user. Send a connect link instead: the client signs in with their own Google account, allows read-only access and picks their sites, which then appear in your account.
1On All sites (or the Overview of an empty account), click Invite a client.
2Add the client's name if you like and click Create link. Copy the link or the ready-made message.
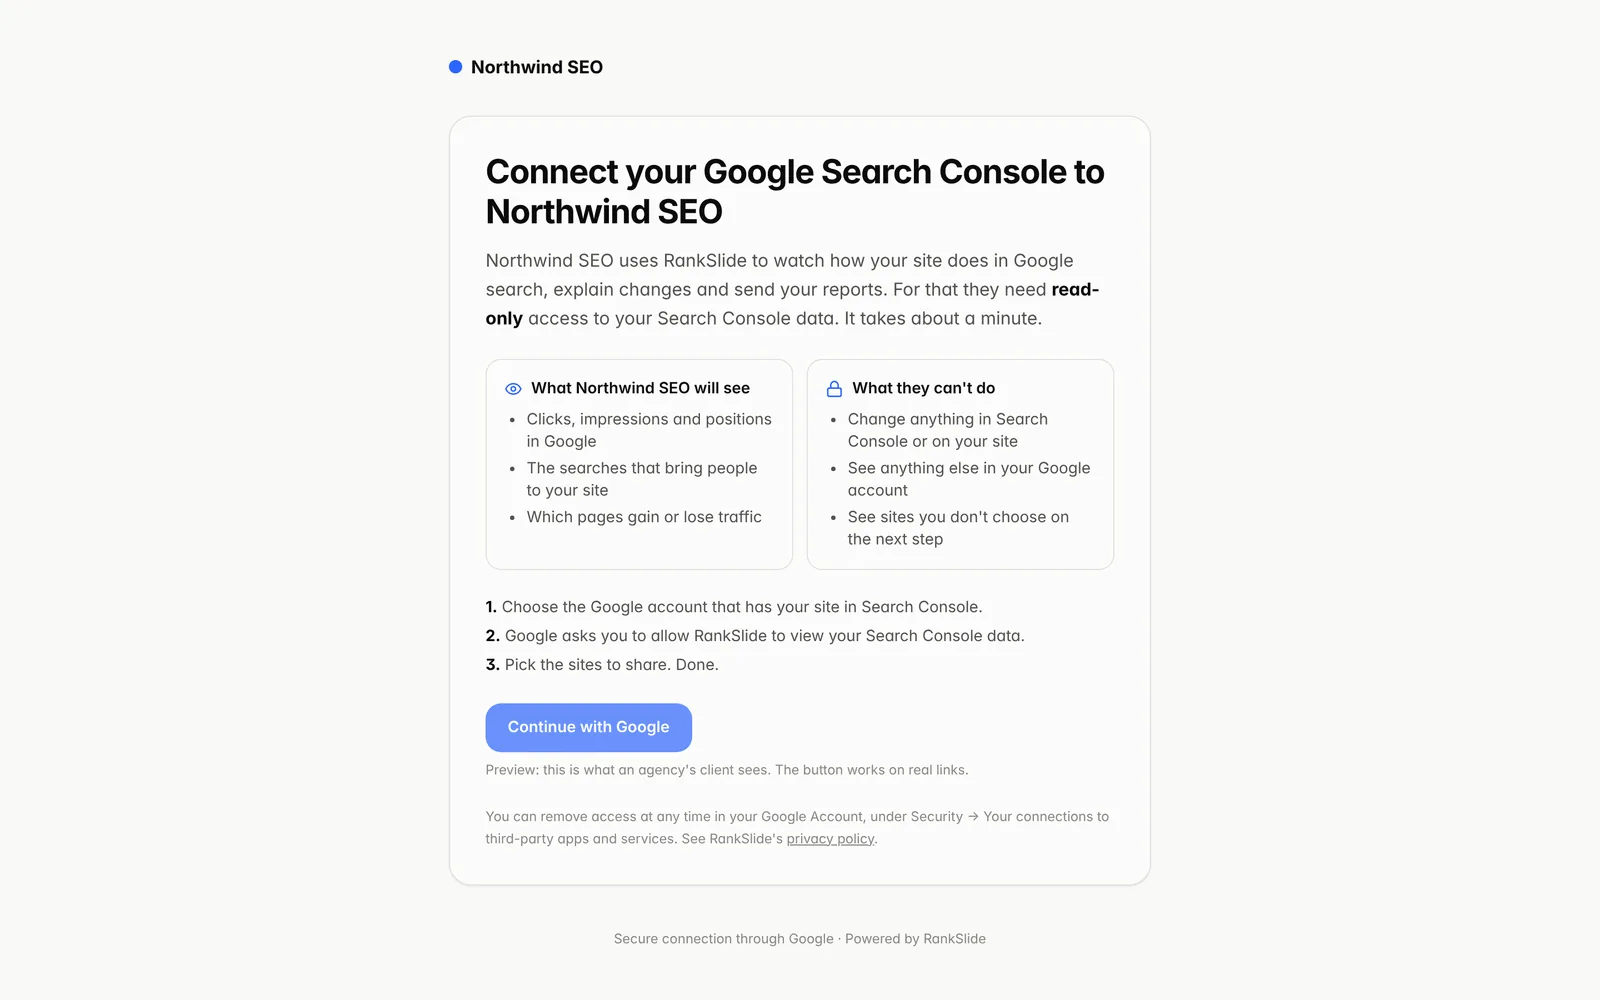
3Your client opens the link, sees your agency's name and logo, and connects. You get an email when they're done.
Each link works once and expires after 14 days. You can cancel it any time.
Sites a client connects keep syncing with the client's own Google access, so it doesn't matter whether your account can see them.
Create a link and send the message as it is.What your client sees: your branding, what you'll see and what you can't do.
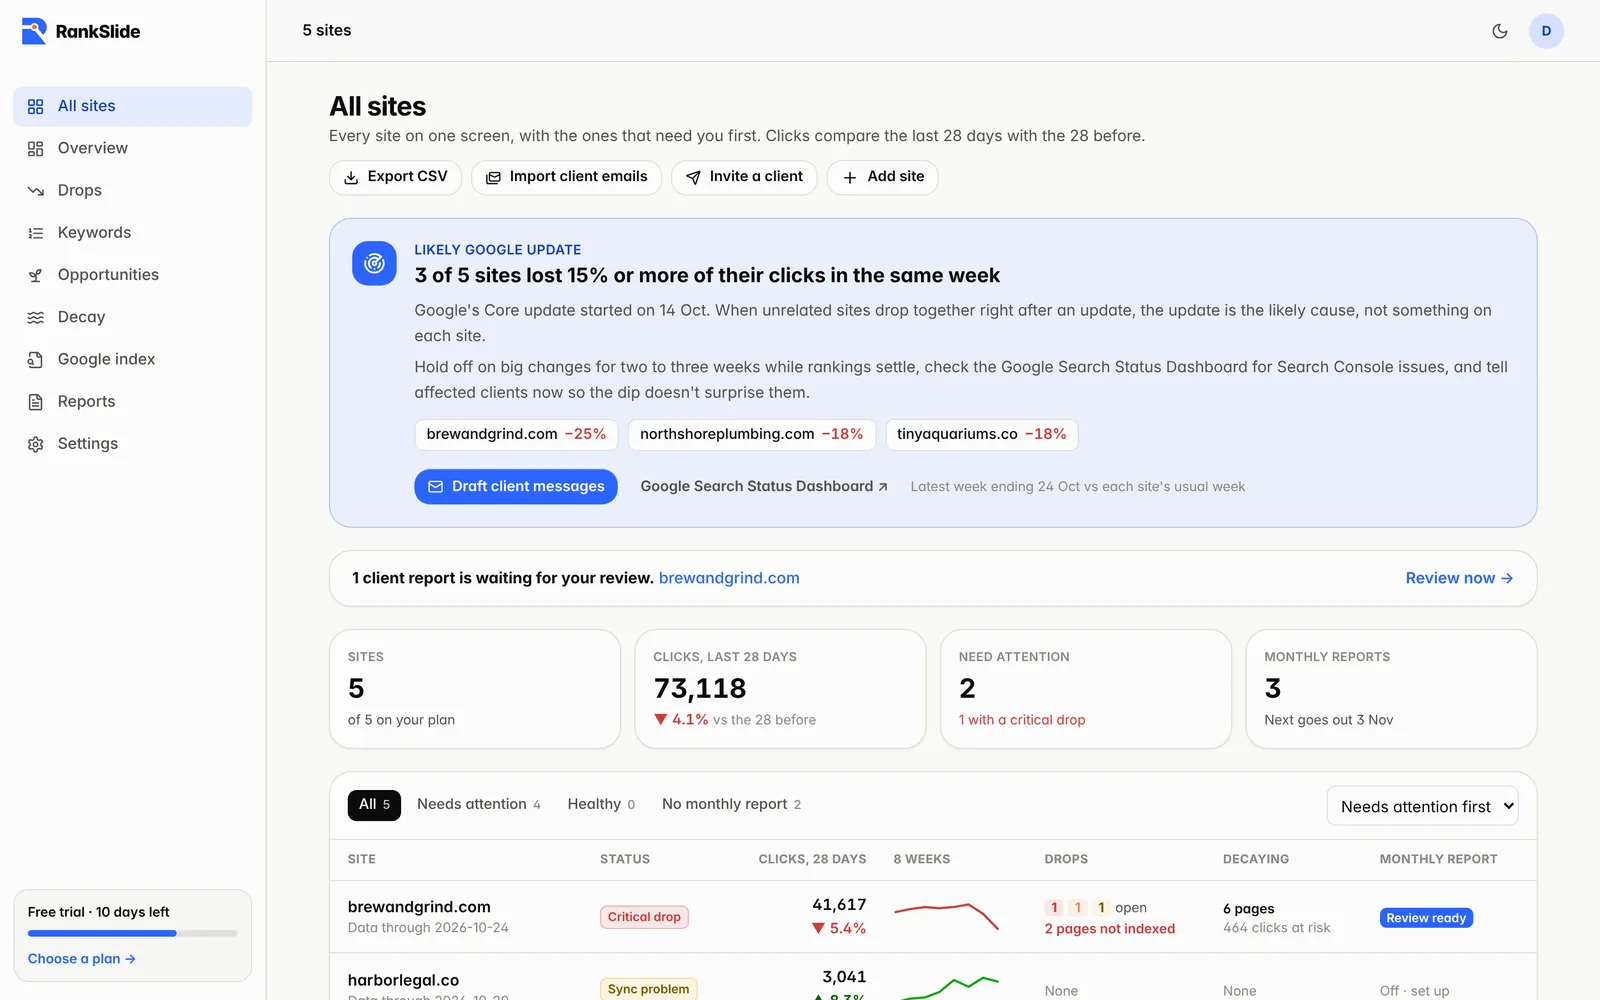
Every site with its status, 28-day clicks against the 28 before, an 8-week trend, open drops, pages not in Google's index, slow decay and the next client report. The sites that need you are sorted to the top.
Filter by Needs attention, Healthy or No monthly report, and sort by what needs attention first, biggest click loss, most clicks or name.
Statuses: Critical drop, Needs attention, Sync problem, Watch, Slow decay, First sync pending, Healthy and Paused (over your plan's limit).
Export CSV downloads the same table for every site.
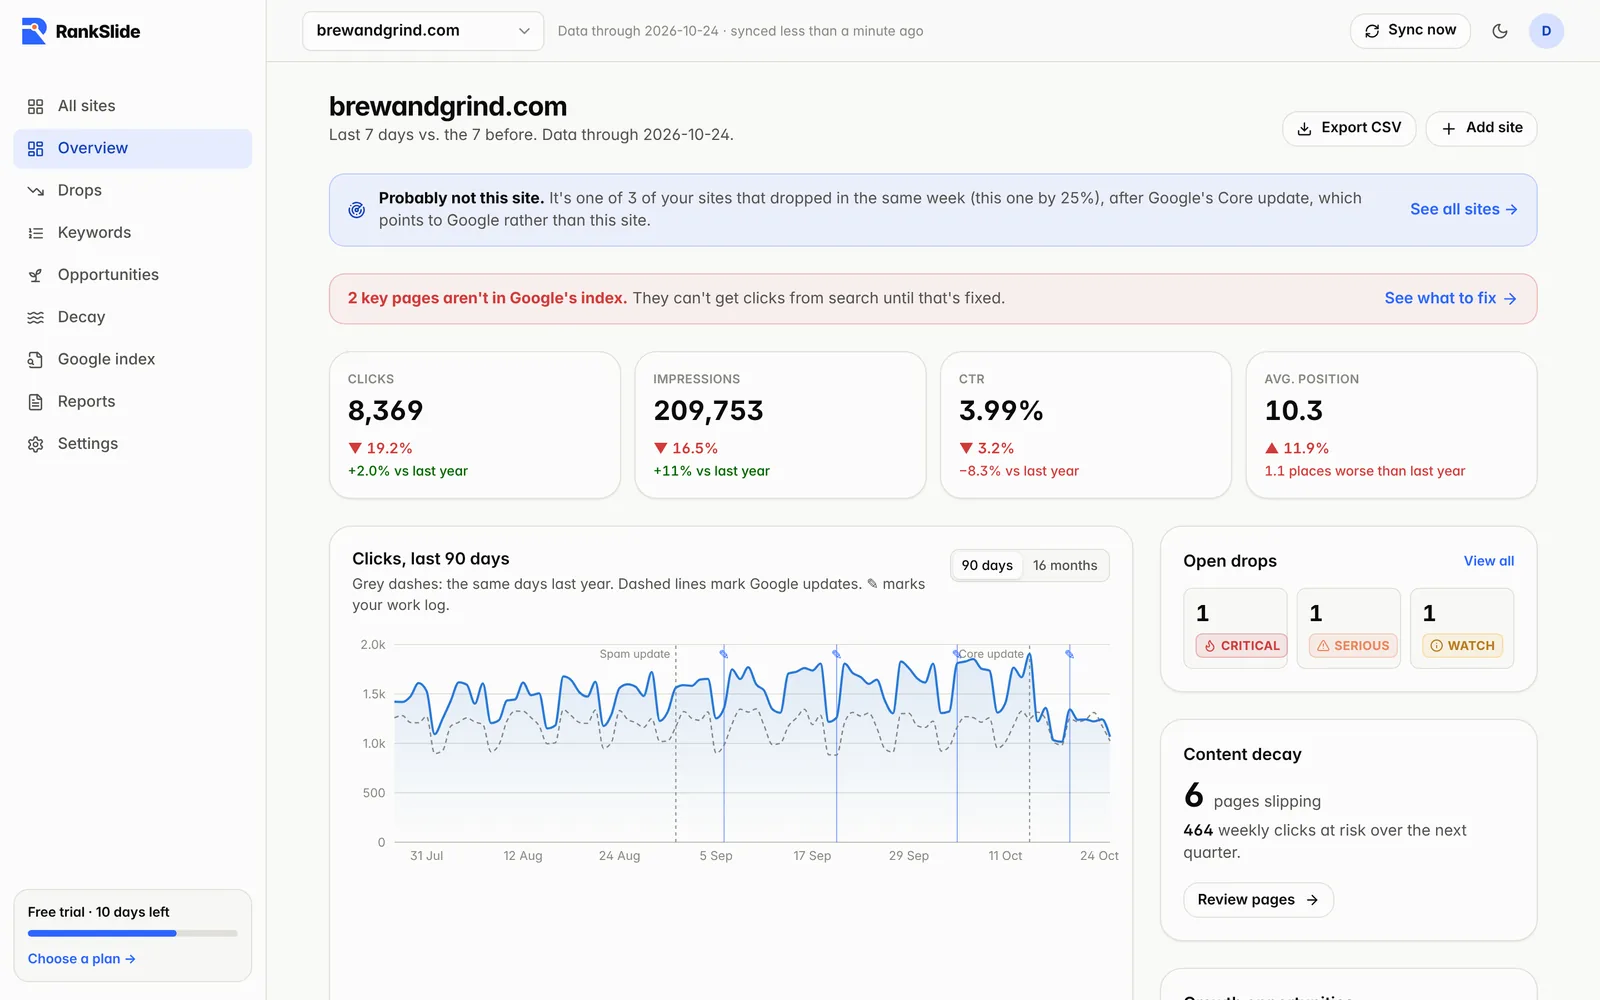
One site at a glance: the last 7 days against the 7 before and against the same days last year, a clicks chart, open drops, decaying pages and growth opportunities.
The chart shows the last 90 days with the same days last year as a grey dashed line. Switch to 16 months to see clicks week by week over the full history Search Console keeps.
Dashed lines on the chart mark Google's announced updates; a pencil mark shows each entry from your work log.
Banners point out anything urgent, like a likely Google update across your sites or key pages missing from Google's index.
Use the site switcher at the top to move between sites; every page keeps the site you picked.
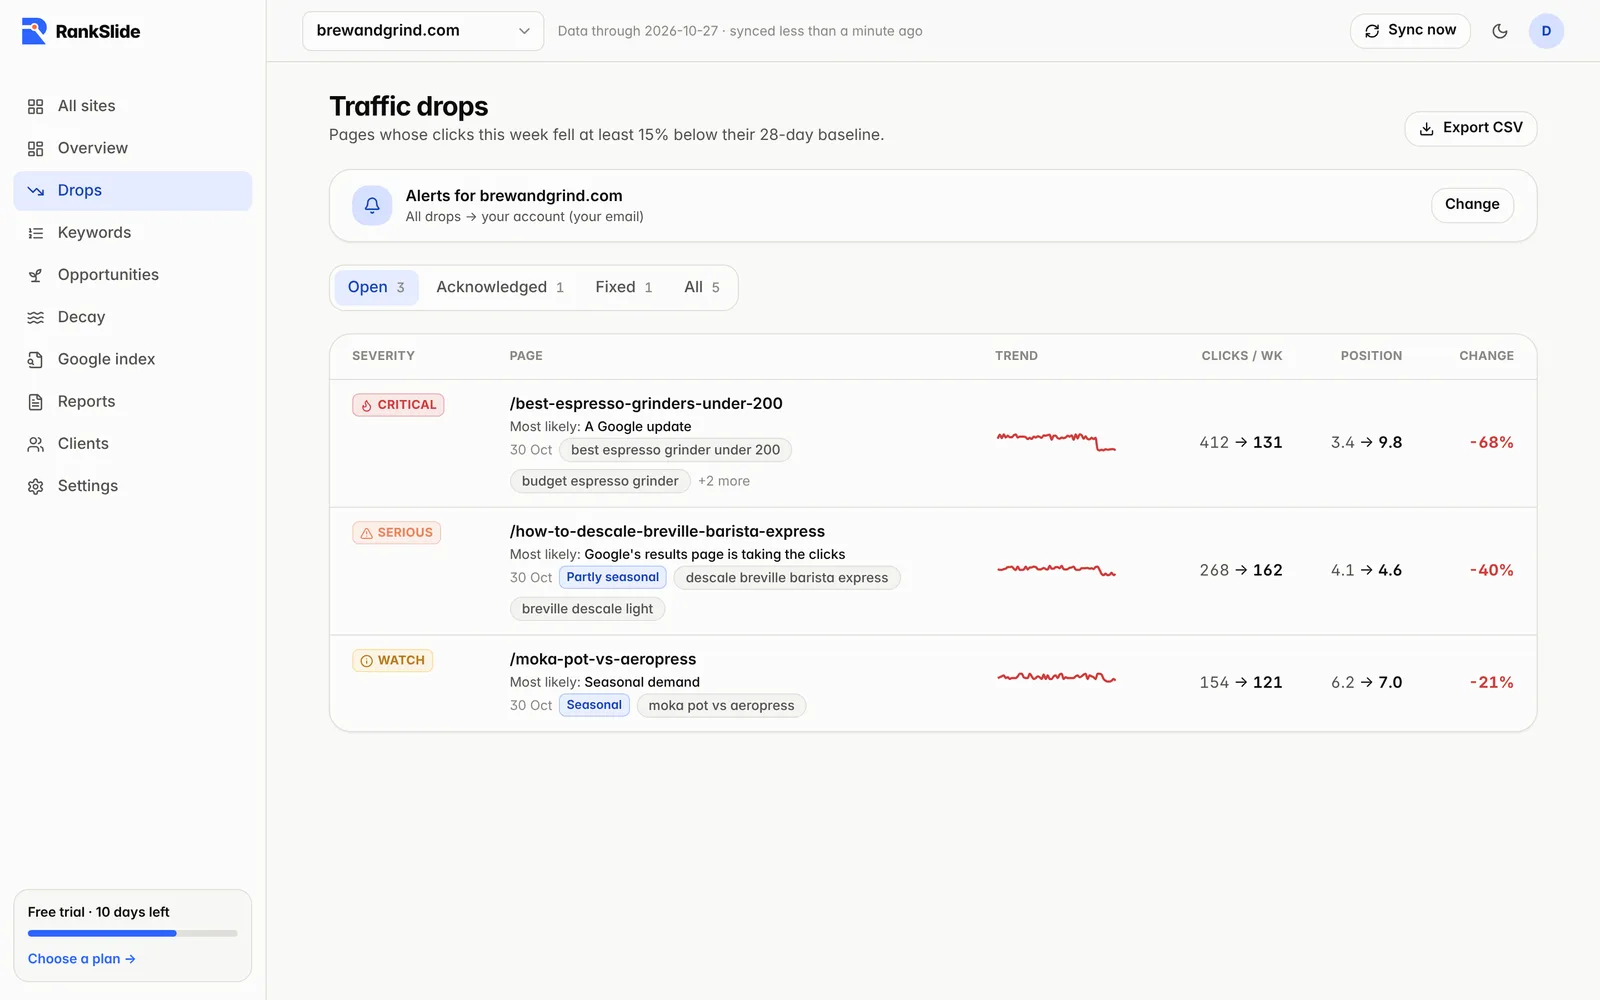
A page counts as dropped when its clicks over the last 7 days fall at least 15% below its average week over the 28 before. 15% is Watch, 30% Serious and 50% Critical.
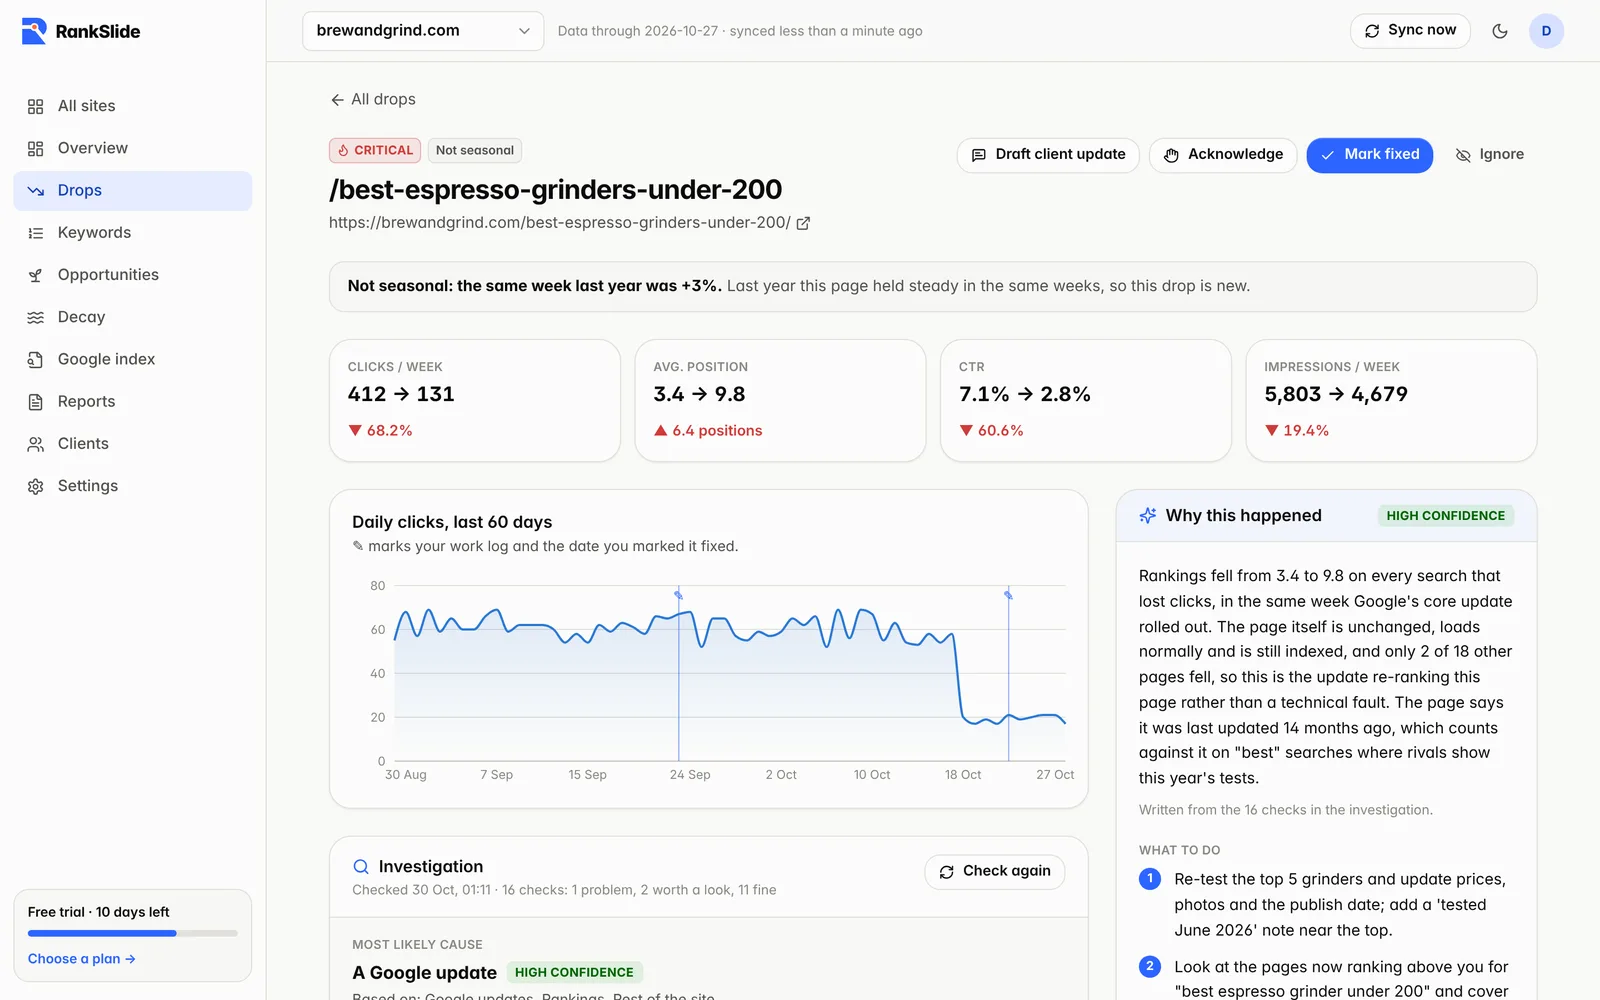
Open a drop to see the daily chart, the searches that lost clicks, the investigation (below), and the likely cause written in plain English with a confidence level and two to four fixes.
Mark a drop Acknowledged, Fixed or Ignore it. Fixed drops are then measured for recovery (below).
Every new drop is checked against the same weeks last year. If the page fell just as much then, it's labelled Seasonal (or Partly seasonal) and doesn't interrupt you with an instant alert.
The year-over-year check, the chart (with your work log) and the explanation.
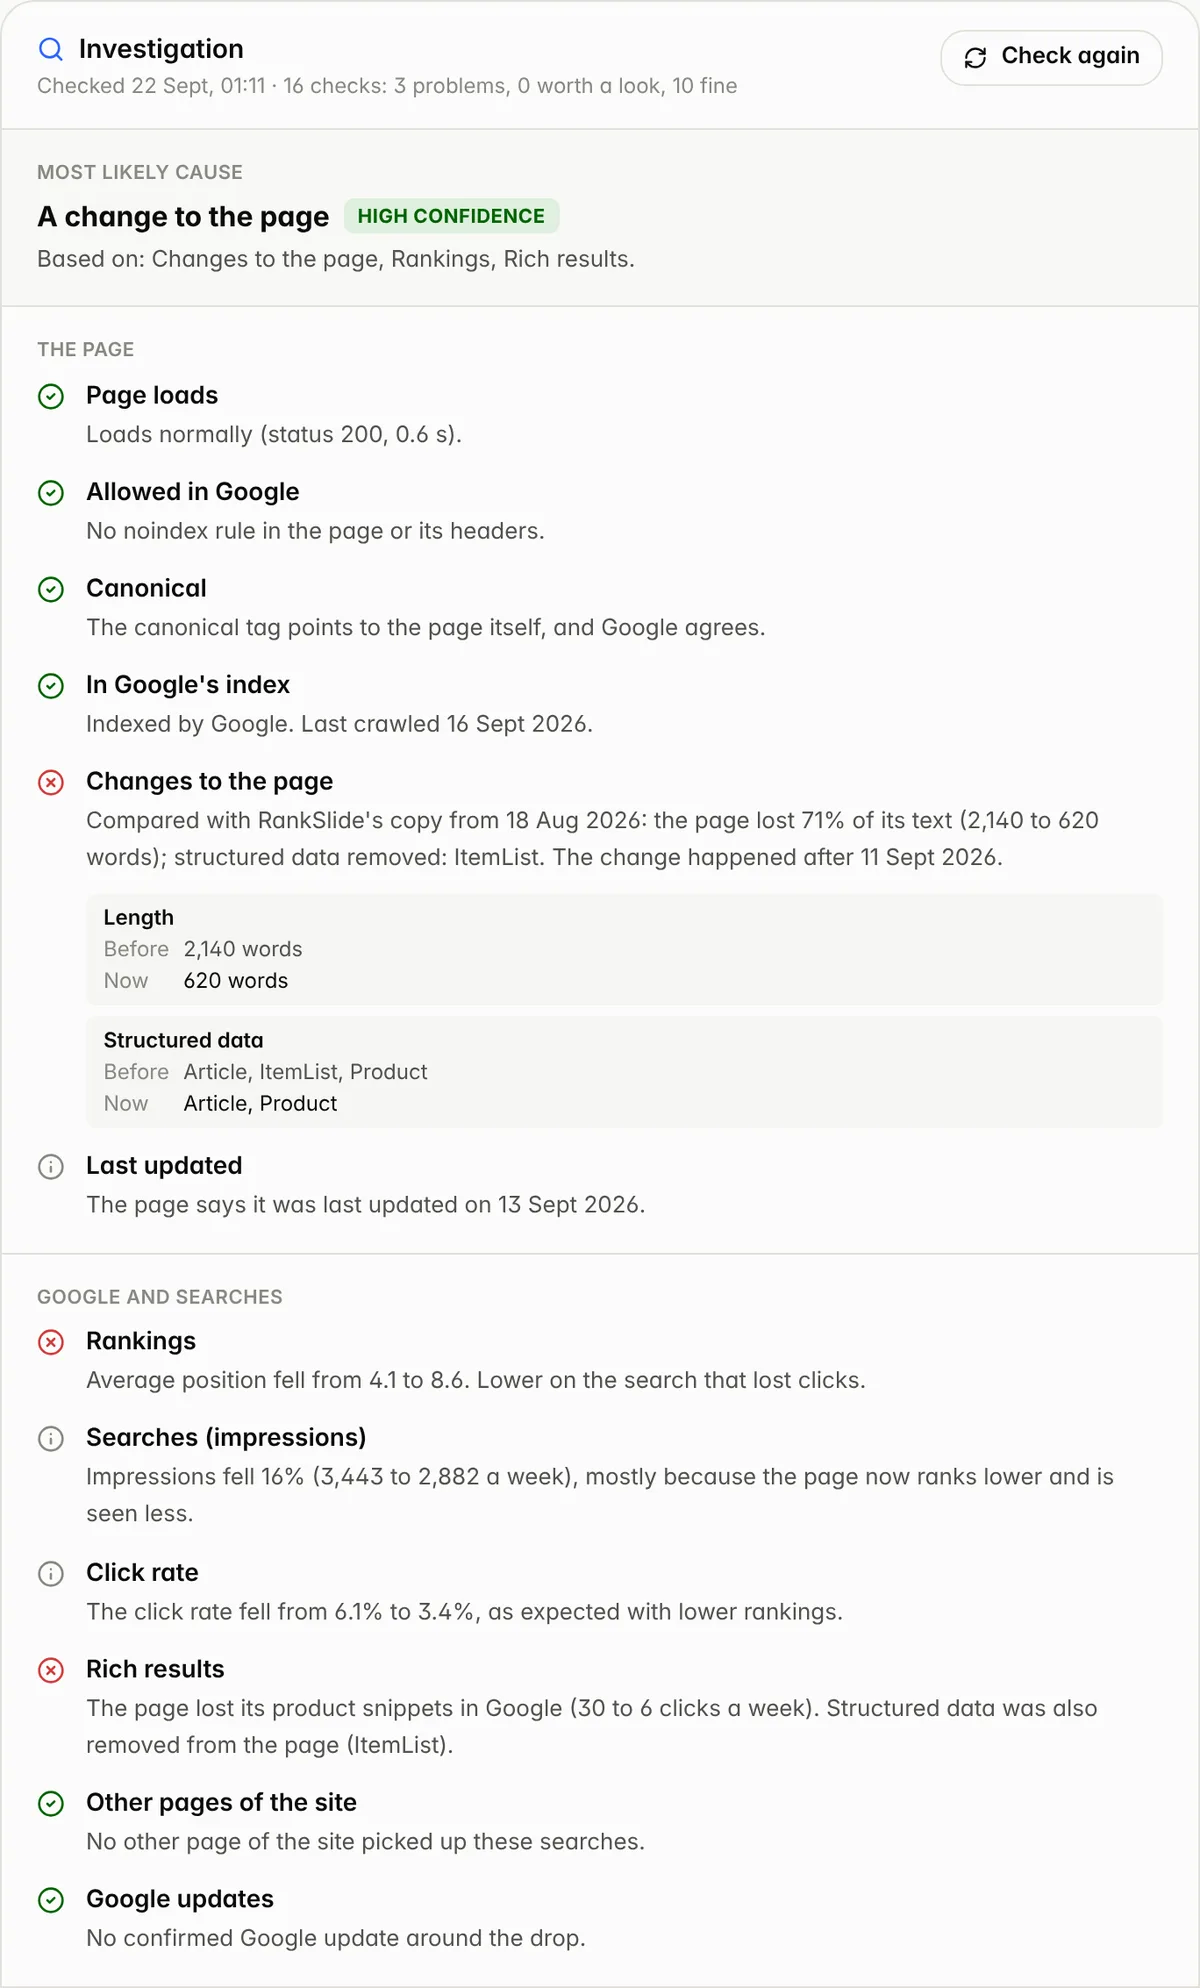
Every new drop is investigated the way an SEO would check it by hand, and the result is a checklist with a verdict on each check and the most likely cause. The explanation is then written from those checks, so it never claims more than they show.
The page: does it load, redirect or return an error; is there a noindex rule or a canonical pointing elsewhere; is it still in Google's index (URL Inspection); and what changed since before the drop: title, main heading, text length, canonical, robots rules, structured data.
Google and searches: did rankings fall, did the searches themselves fall, did the click rate fall while rankings held (an AI Overview or other result taking clicks), were rich results such as review stars lost, did another page of the site take the searches, and was there a Google update.
Who lost the clicks: mobile vs desktop, the countries behind the loss, and, for a mostly-mobile drop, Google's mobile speed test with real-user Core Web Vitals.
Context: how many of the site's other pages fell the same week, whether the rest of the page's section fell with it (see Site sections), and the same weeks last year.
To show what changed, RankSlide keeps a copy of each key page about once a week. Before it has one, it compares with the Internet Archive's copy when there is one.
Check again re-runs it after a fix. Reports, the client dashboard, alert emails, webhooks and CSV exports include what was found and what was ruled out.
Site owners: our checks load pages with the user agent “RankSlide/1.0”, a few times a week per key page, and only pages that appear in your Search Console data.
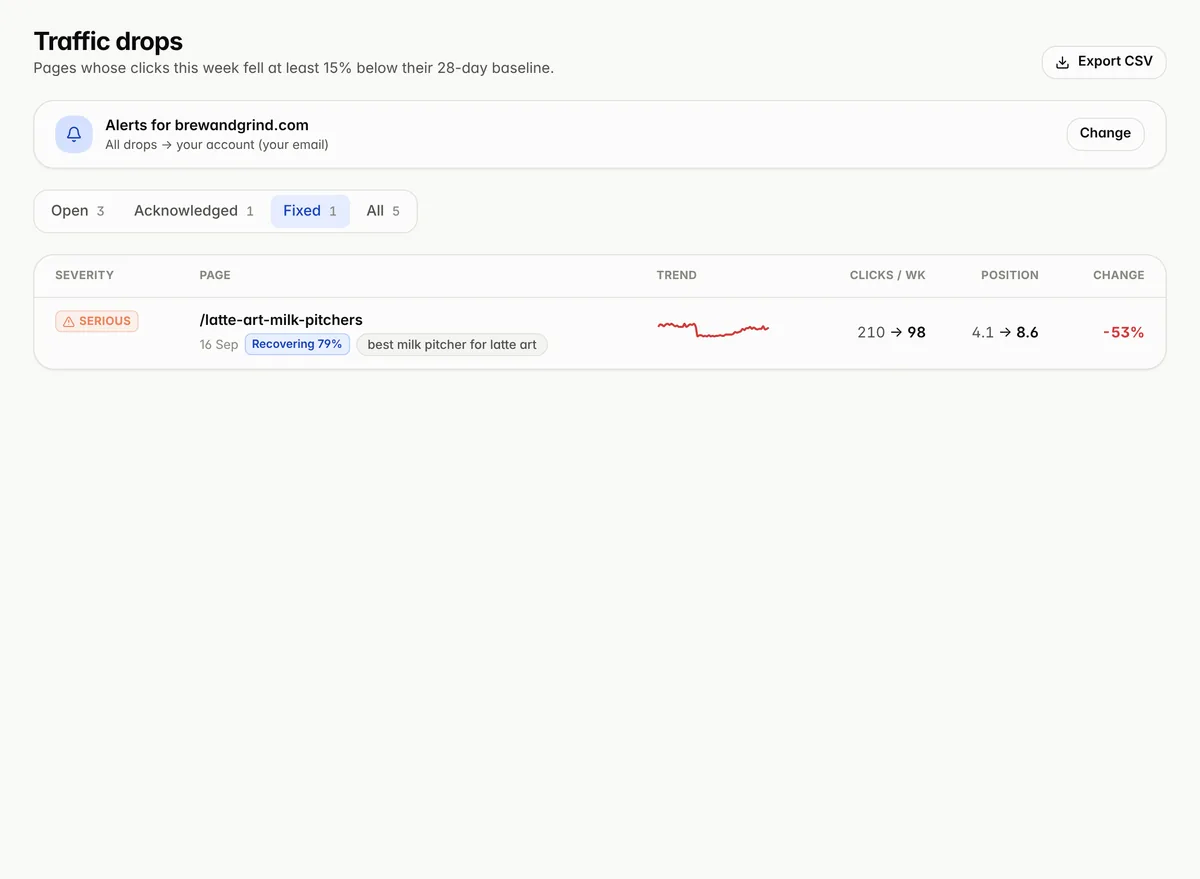
Mark a drop as fixed and RankSlide measures the page every night for the next 120 days. After a full week it shows how much of the lost traffic is back, on the drop and in that month's client report.
“Recovering” means at least 30% of the lost clicks are back.
The Fixed filter on the Drops page lists every fixed page with its progress.
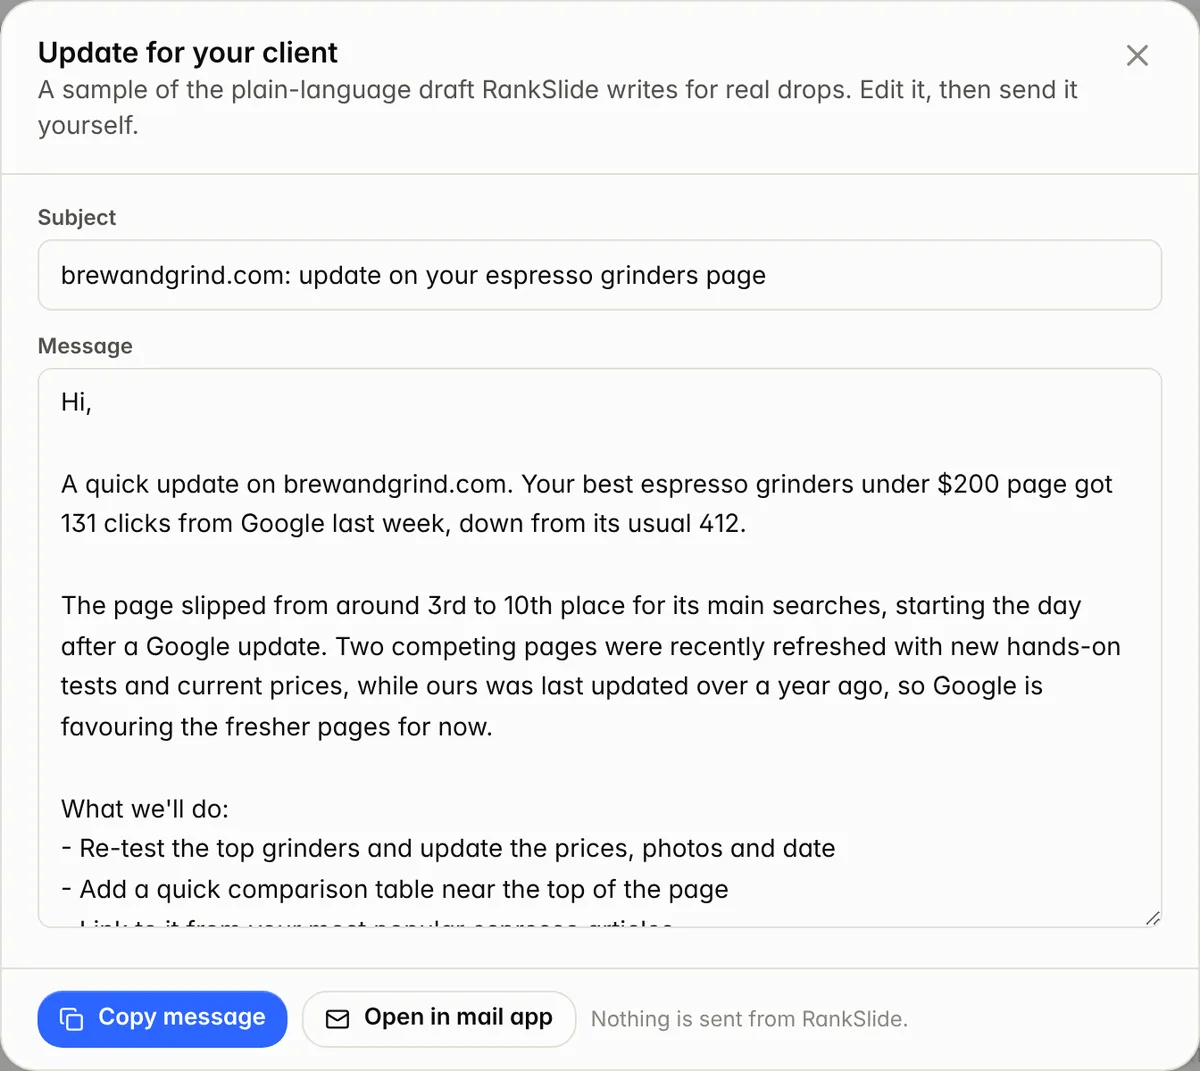
When a client's page drops, Draft client update writes a short, plain-language email about it: what happened, the likely reason and what you'll do, signed with your agency name.
Edit it, then copy it or open it in your mail app. Nothing is sent from RankSlide.
It avoids SEO jargon, so the client understands it without a call.
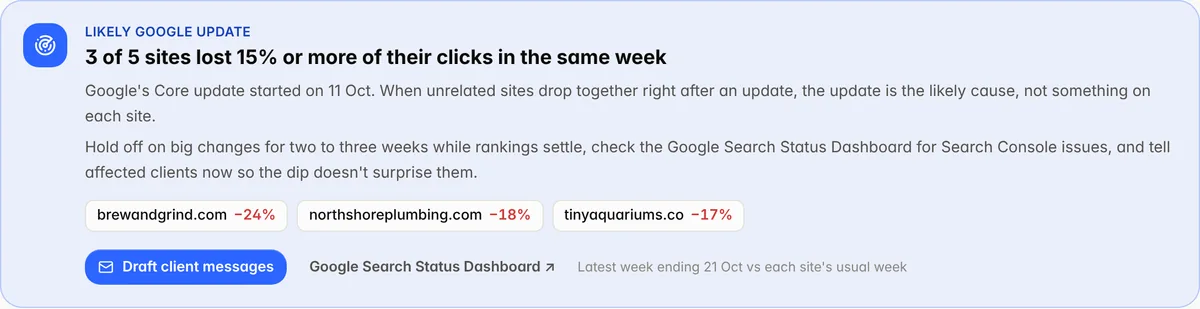
When 3 or more of your sites lose 15% or more of their clicks in the same week, the cause is probably on Google's side, not any one site. RankSlide flags it once (naming the update if Google announced one) and drafts a short message for each affected client.
The alert goes out straight away on your channels, at most once every 3 weeks.
The banner on All sites and Overview links to Google's status dashboard and lists the affected sites.
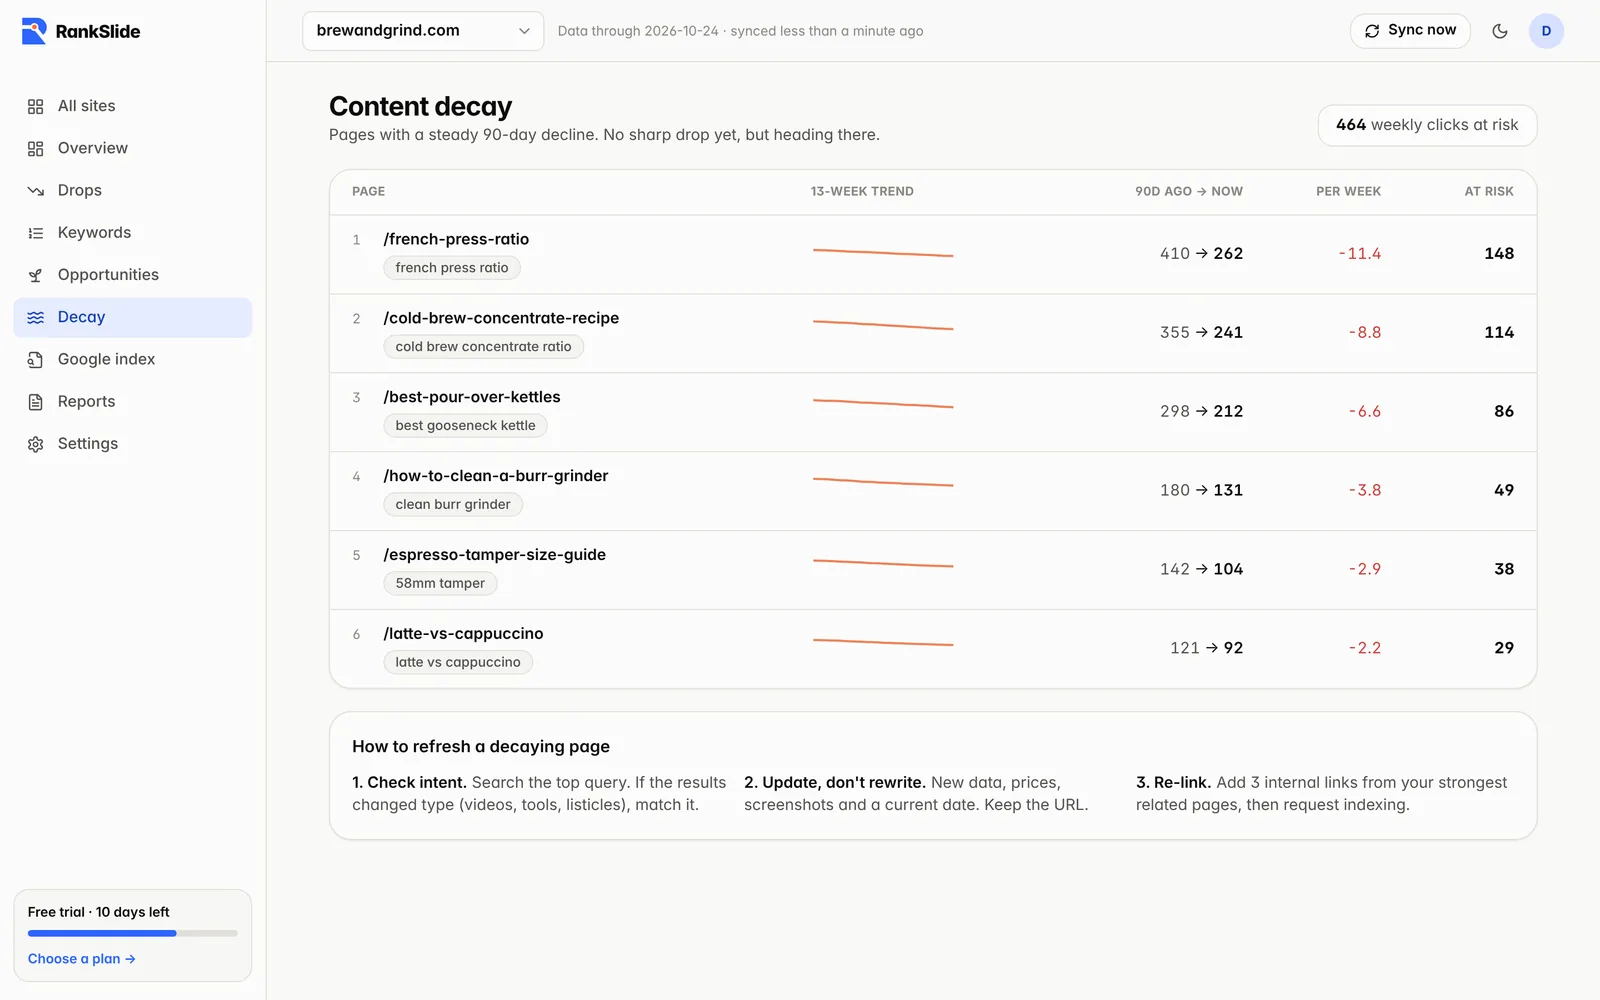
Pages on a steady 13-week slide that have lost 20% or more of their clicks, caught before they become a cliff, with the clicks at risk if the trend continues.
Each page shows its main search and a 13-week trend line.
The page includes a short checklist for refreshing a decaying page.
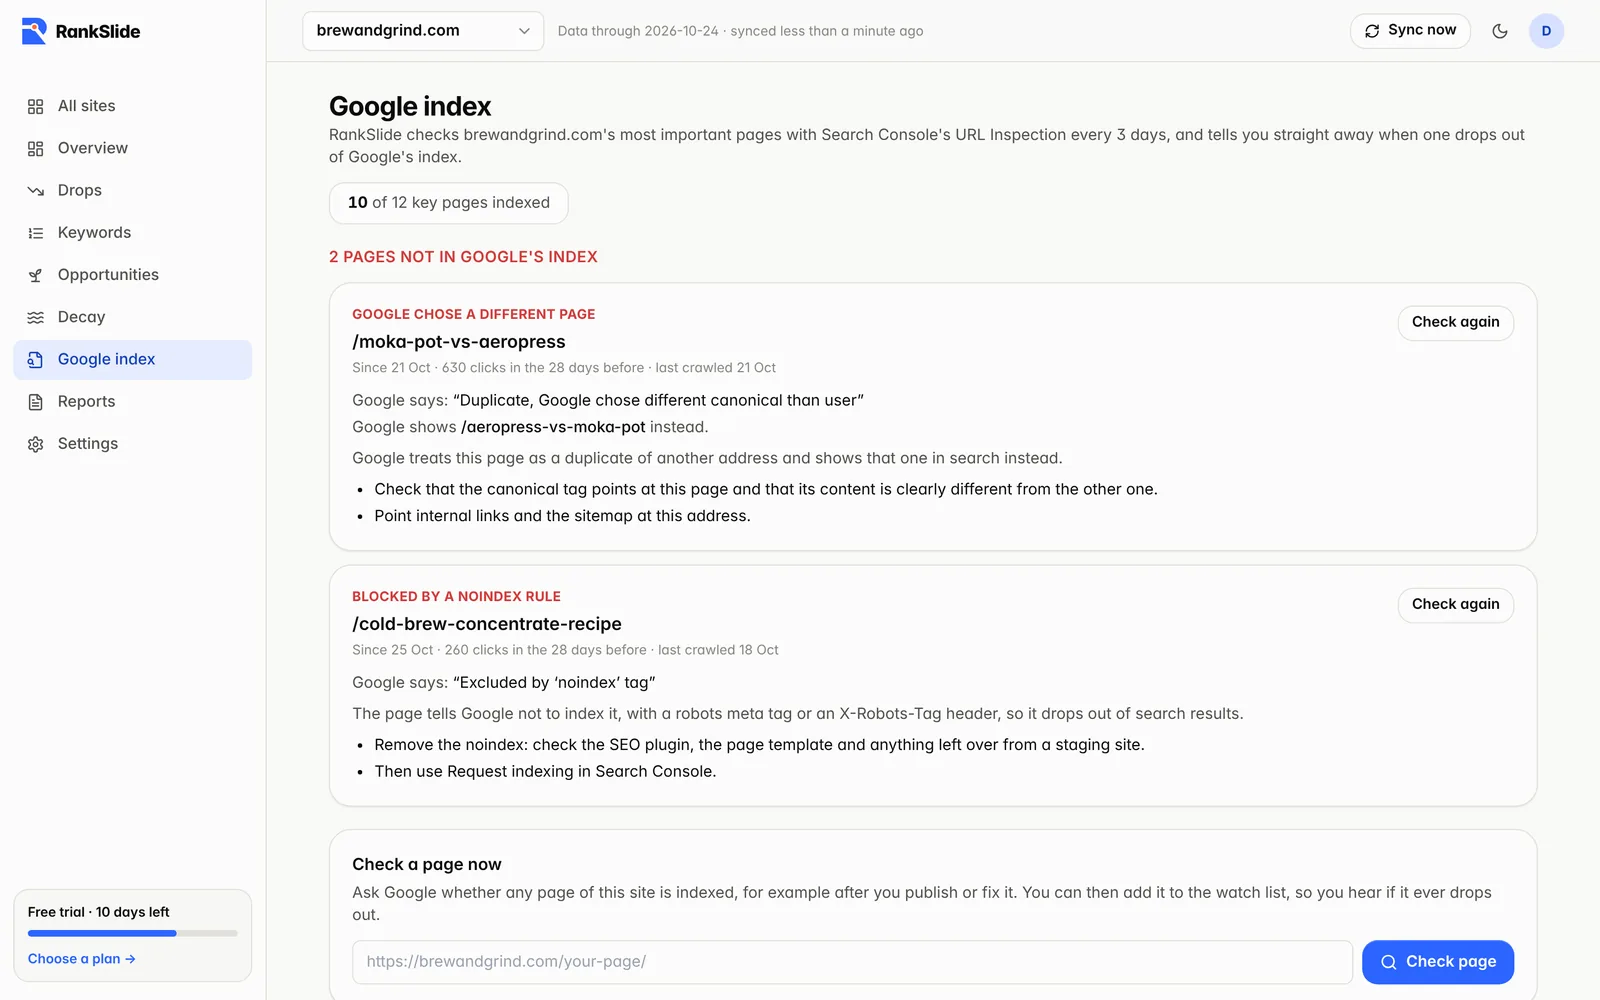
RankSlide checks each site's 50 most important pages (by clicks, then impressions, so new and small sites are covered too), any page with an open drop, and up to 50 pages you add yourself, using Search Console's URL Inspection. When a watched page drops out of Google's index, you get one alert with Google's reason and what to fix.
Pages are checked every 3 days; pages with a problem or an open drop are checked daily (up to 20 checks per site per day).
Problems are explained: noindex, blocked by robots.txt, not found, soft 404, server error, access denied, redirect, Google choosing another page as canonical, or not indexed.
Check a page now asks Google about any page of the site on demand, for example right after you fix it. Watch this page then adds it to the list, so a new page that has no clicks yet is watched too.
The monthly client report includes one line on how many key pages are indexed.
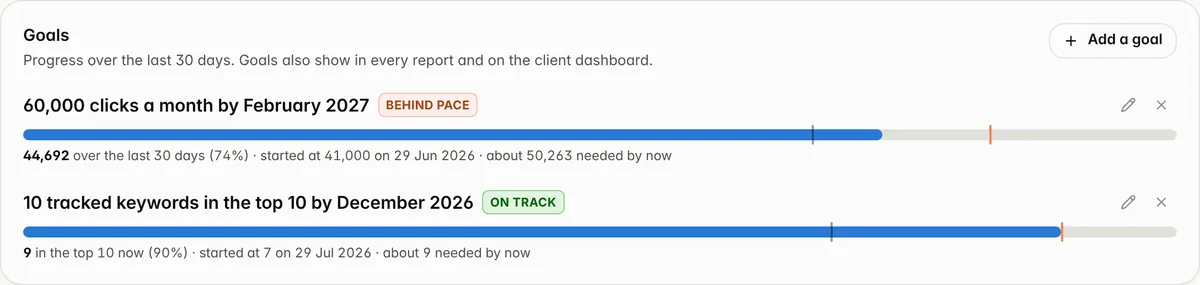
Agree a target with each client and show the progress: up to three goals per site, each for clicks, non-brand clicks or impressions a month, or tracked keywords in Google's top 10, with an optional deadline.
Add a goal on the site's Overview. Its starting point is where the site stands that day (the last 30 days), so the bar shows how far it has come, not just how far it has to go.
With a deadline, RankSlide draws a straight line from the starting point to the target and says whether the site is on track or behind, and roughly what it needs by now.
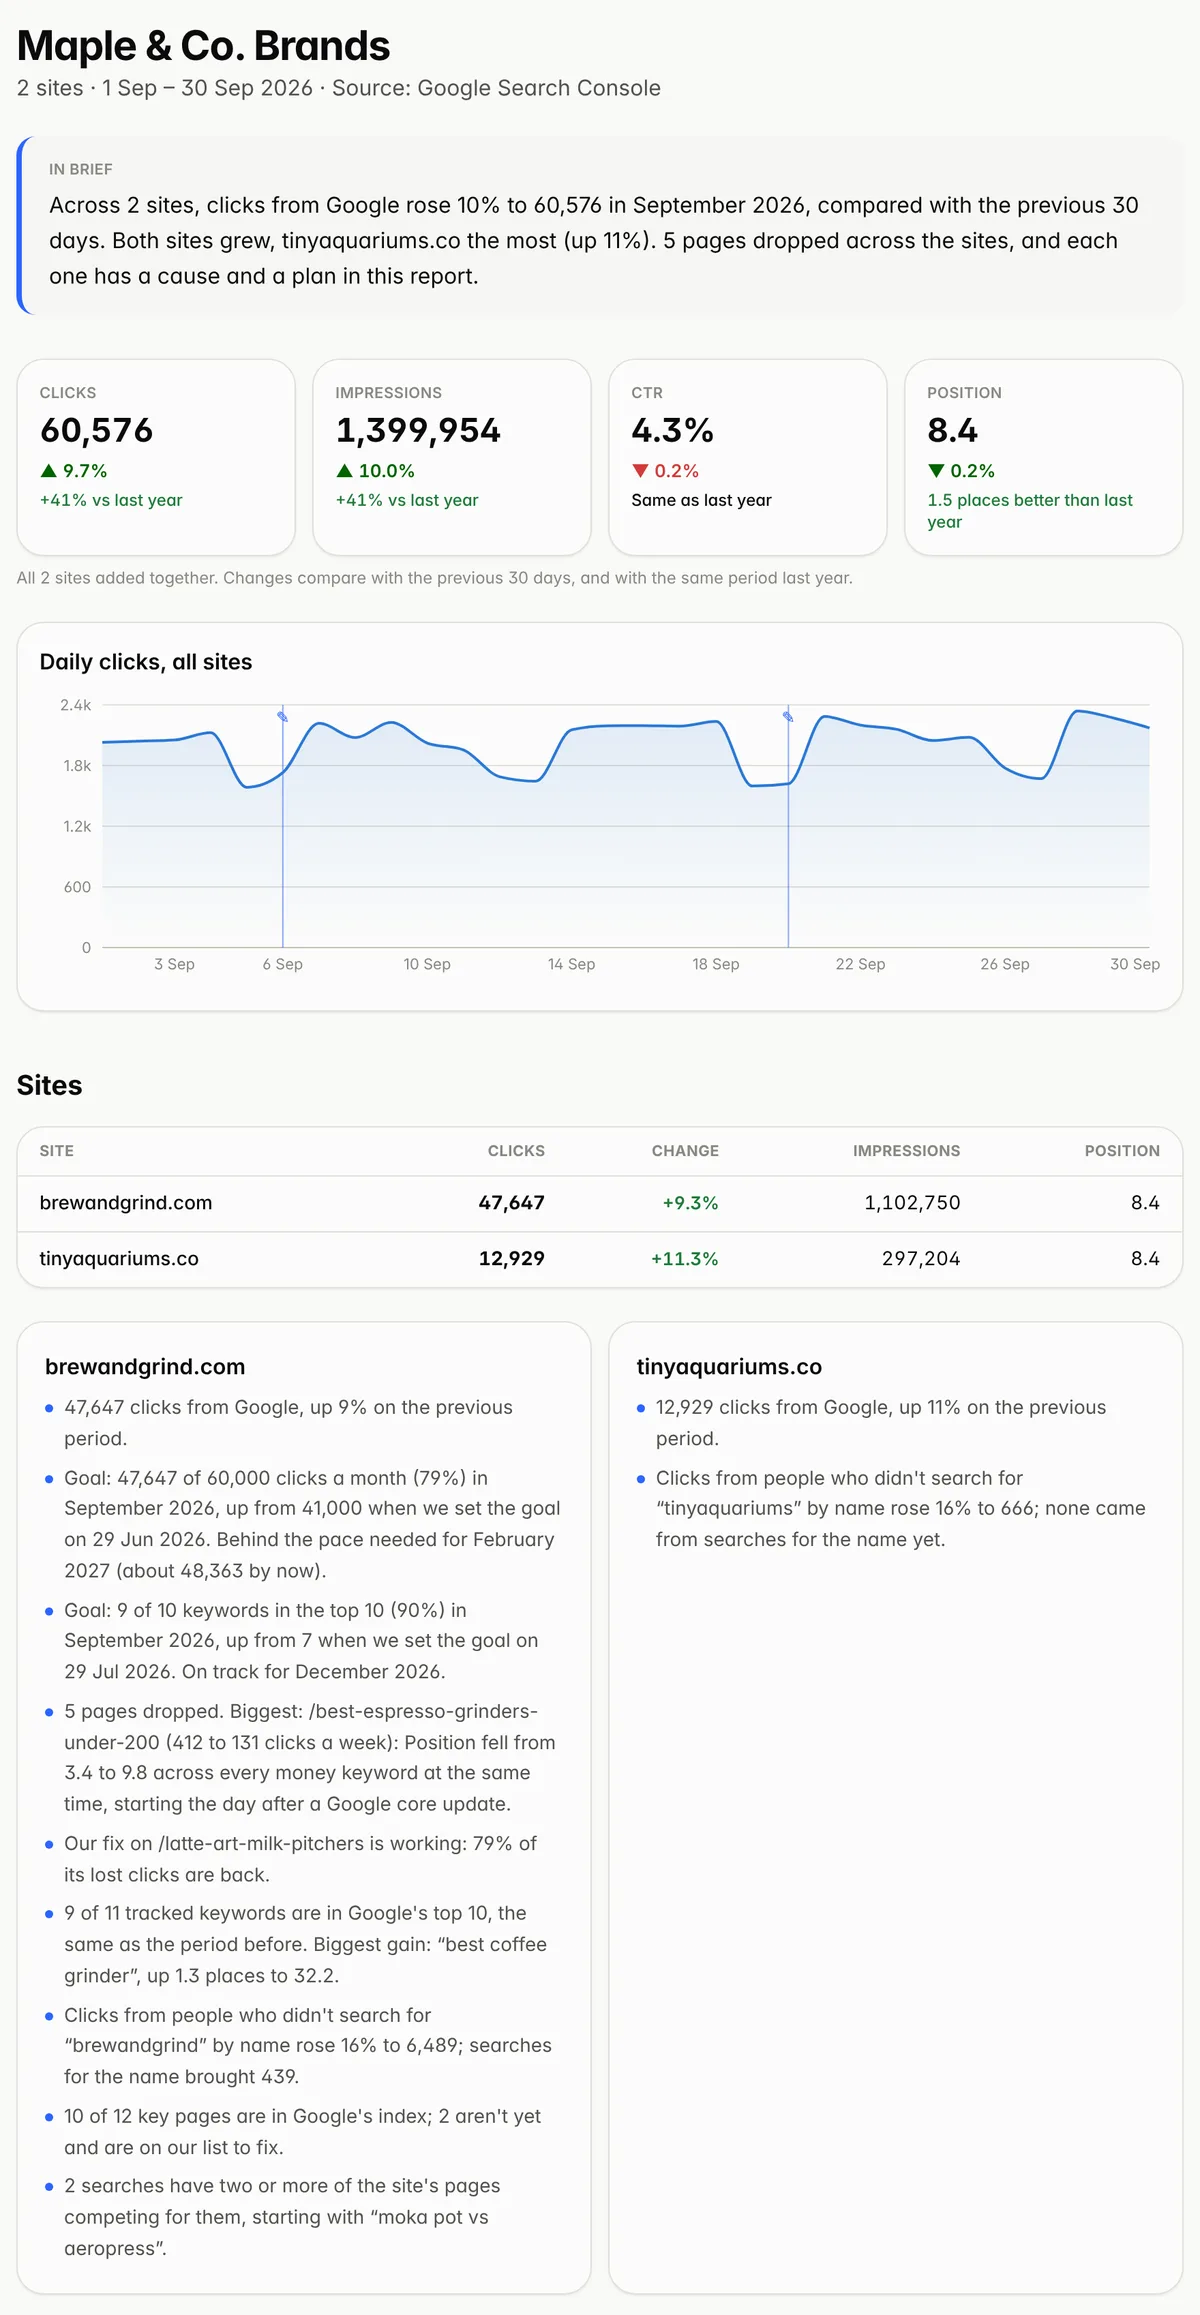
Goals show at the top of every report (PDF and online), in the monthly email, on the live client dashboard and in the In brief summary. A whole-month report measures the month itself; other periods use a 30-day pace.
A goal that's behind pace goes into the draft of next month's plan. Untick Goals under “What's in this site's reports” to leave them out for a client.
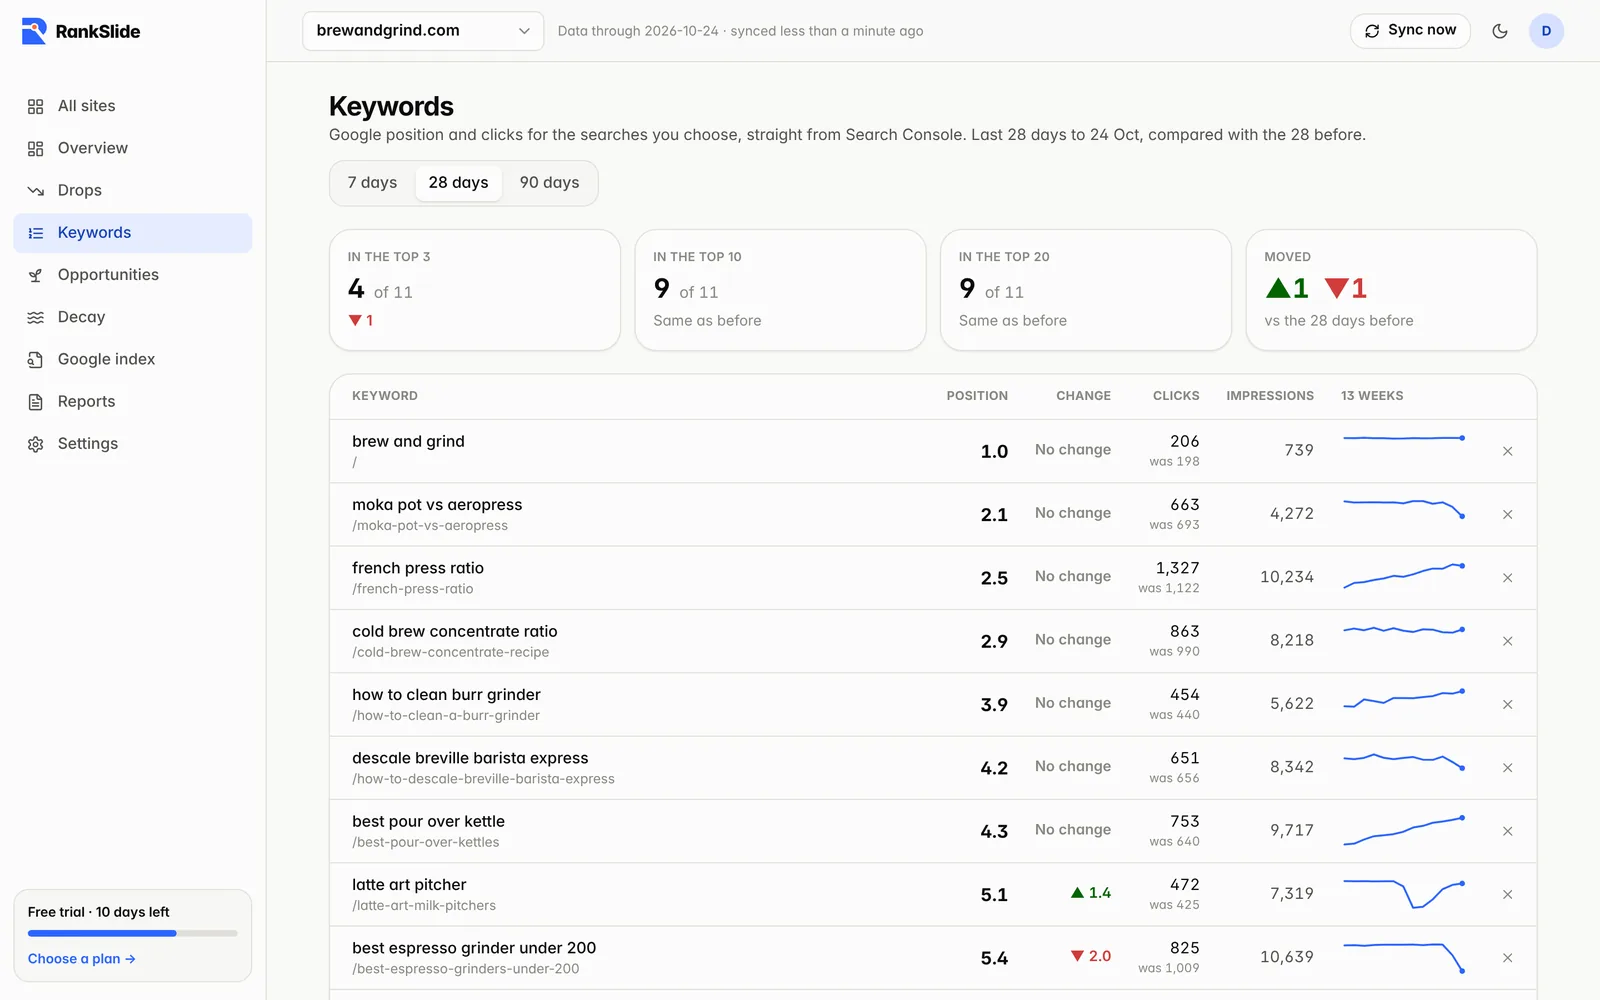
Track the searches your client cares about: up to 50 per site. Positions, clicks and impressions come straight from Search Console for each search as a whole, so they match what you see there, and each new keyword loads up to 16 months of history straight away.
Paste keywords one per line, or add the site's top searches from the suggestions with one click.
Each keyword shows its average position, the change from the previous 7, 28 or 90 days, clicks, impressions, the page that ranks for it and a 13-week trend.
Counts of keywords in the top 3, top 10 and top 20 show at a glance whether the site is moving up.
Every tracked keyword goes into the client report (PDF and online), with one line on the top-10 count in the report email.
Updated daily with the rest of the site's data. A keyword with no impressions shows a dash: it usually ranks below the first few pages.
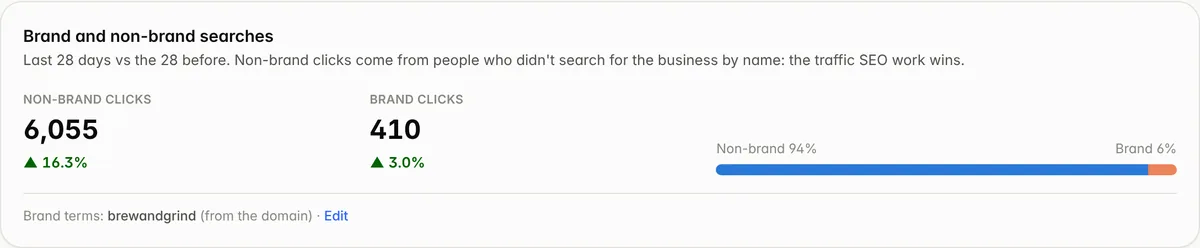
Clicks split into searches for the business by name and everything else. Non-brand clicks are the ones SEO work wins, so they show progress even when brand searches go up and down with advertising or the season.
Shown on each site's Overview for the last 28 days against the 28 before, and in every client report, email and live client dashboard.
Brand terms start from the domain name. Click Edit under the split to add the business name, other spellings and product names. Spaces, capitals and punctuation don't matter: “brewandgrind” matches “brew and grind”. Terms under 5 letters, like an abbreviation, match whole words only, so “ews” matches “ews electrical” but not “reviews”.
Searches Google keeps private for privacy reasons aren't in the search data, so brand plus non-brand is a little below the site's total clicks.
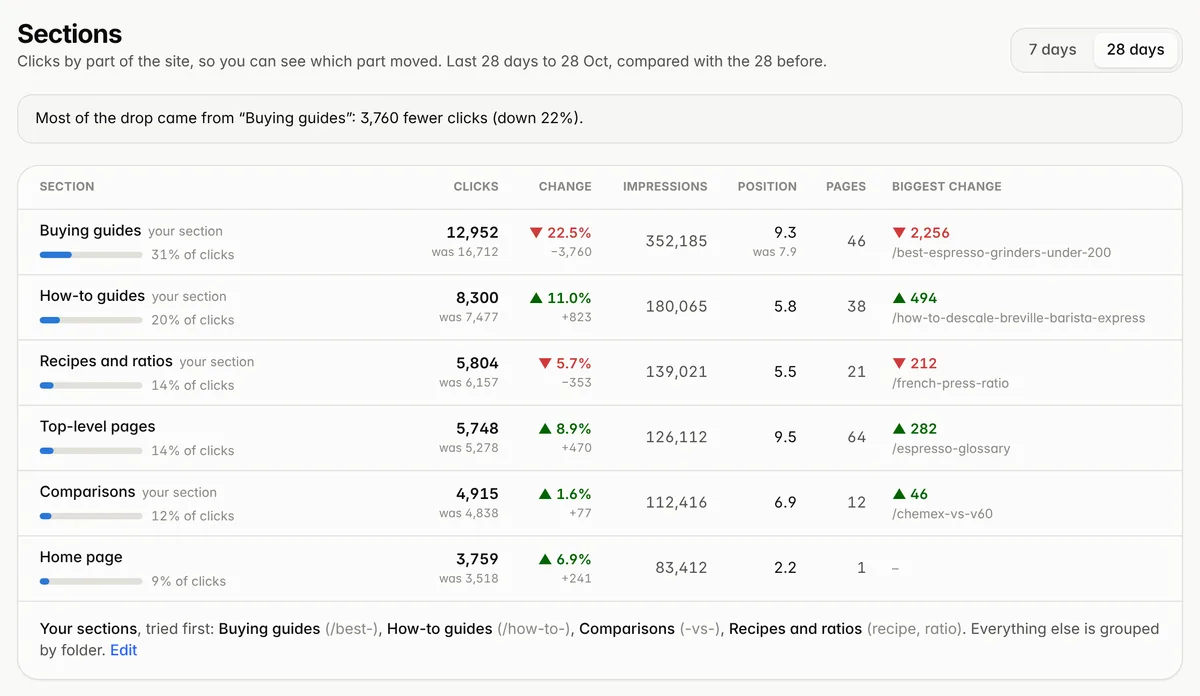
Clicks grouped by part of the site, like /blog/, /products/ or /services/, so a change in traffic comes with where it happened. For sites whose pages have no folders, make your own sections by URL pattern.
The Sections page lists each section's clicks, change, impressions, average position, number of pages and the page that moved most, for the last 7 or 28 days against the same number of days before. Each site's Overview shows the top five.
Sections follow the first folder of each URL (/blog/), or the first two after a language folder (/de/blog/). The home page, pages with no folder (such as /about) and each subdomain are sections of their own.
Add your own under the table: a name and one or more URL patterns. A pattern starting with / matches the start of the path, anything else matches anywhere in it, and * matches anything. Yours are tried first, in order, and everything else stays grouped by folder. For a WordPress site with posts at the root, try “Buying guides” for URLs containing /best-.
Every traffic drop checks the rest of its section: when most of the section's other pages fell the same week while the rest of the site held up, the cause is more likely something they share, like their template, a category change or internal links.
Client reports, the monthly email and the live client dashboard include the sections table, with smaller sections added together, in the report's language. Leave it out per site under “What's in this site's reports”.
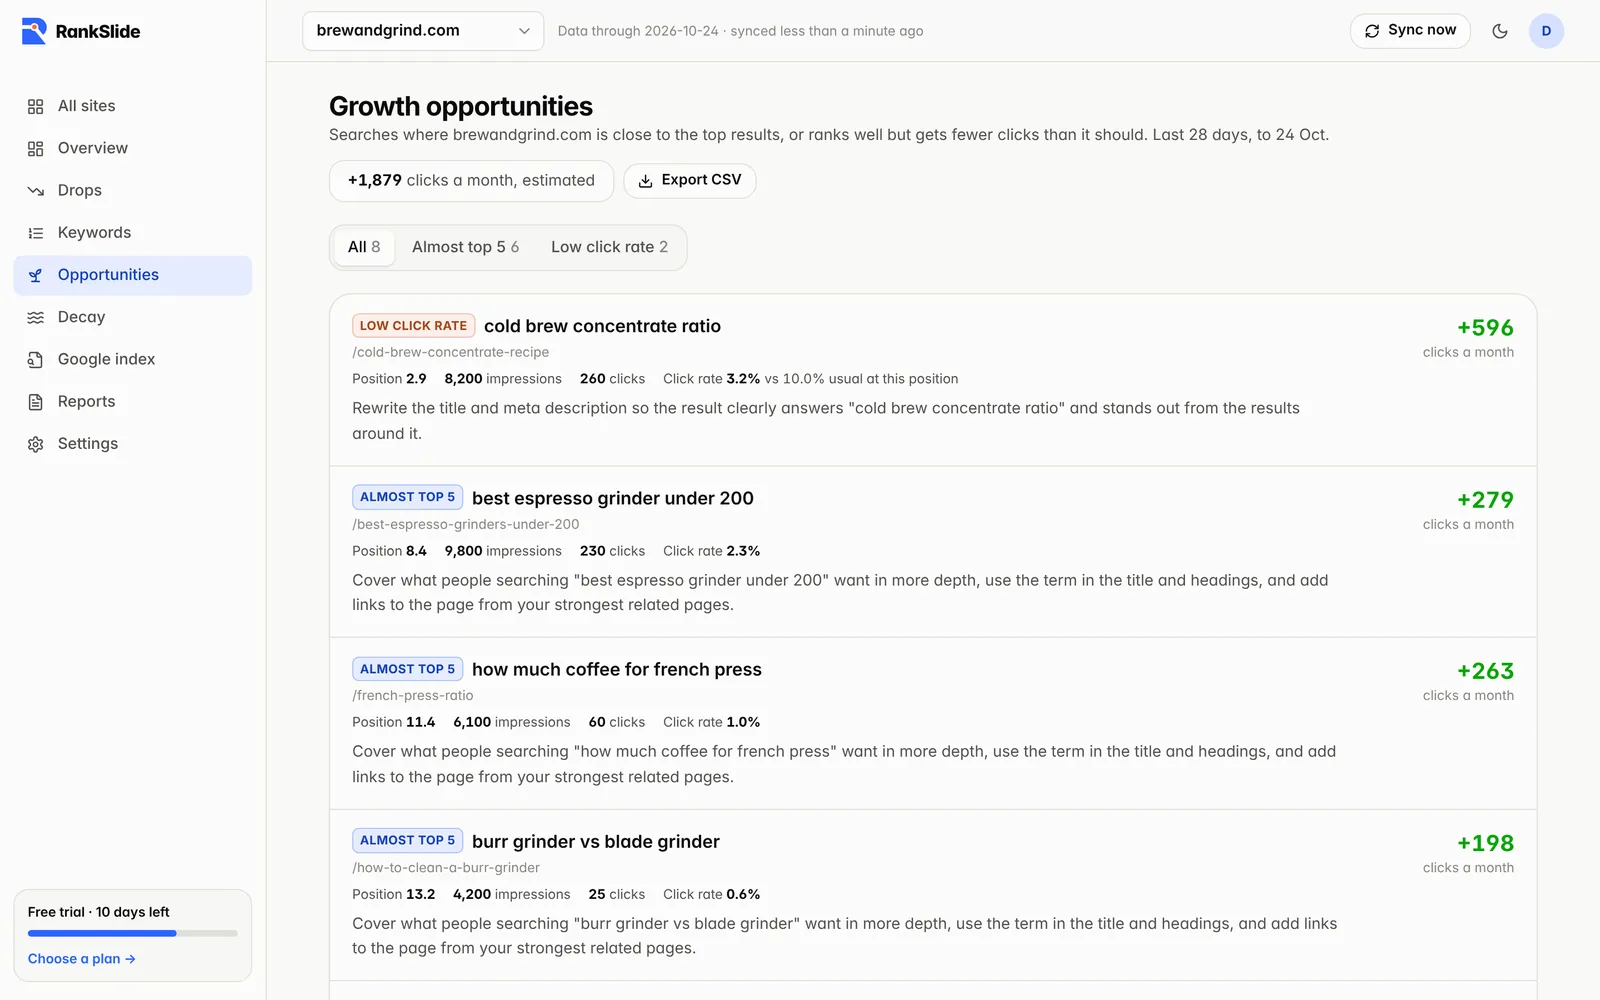
Not just damage control: searches where a page sits just below the top five, or ranks well but gets fewer clicks than it should, with the extra clicks each could bring and what to do.
Close to page one: position 8 to 20 with at least 100 impressions, estimated as if the page reached position 5.
Low CTR: position 6 or better with at least 200 impressions and a click rate well below usual for that position.
Estimates use the site's own click rates where it has enough data. The top three go into the monthly client report.
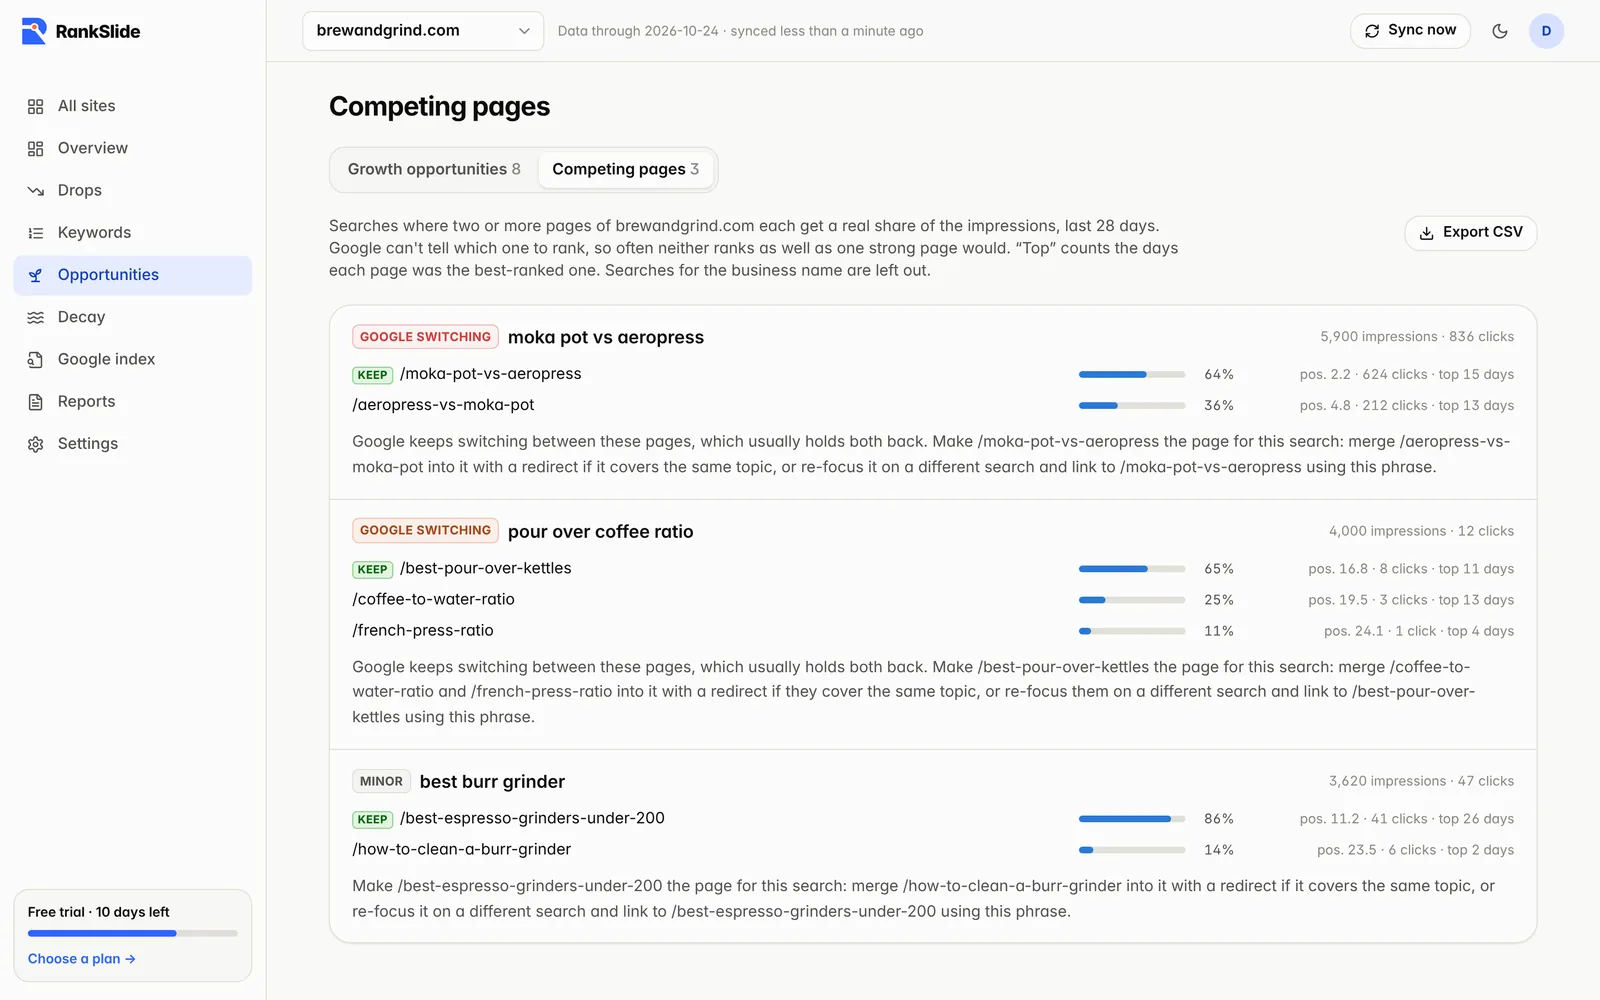
Searches where two or more of the site's pages each get a real share of the impressions. Google can't tell which one to rank, so often neither ranks as well as one strong page would.
Open Opportunities → Competing pages. Each search shows its pages, each page's share of impressions, average position, clicks, and on how many days it was the best-ranked page.
“Google switching” means two pages each took the top spot on a real share of days: the clearest sign they hold each other back. “Split” means the second page still gets a fifth of the impressions or more.
The page to keep is the one with the most clicks. The advice: merge the others into it with a redirect if they cover the same topic, or re-focus them on a different search and link to the page you keep.
Searches for the business name are left out (several pages showing for it is normal), using the site's brand terms.
The top three go into the client report with the opportunities, and into the draft of next month's plan. Download them as CSV, or add them to a live Google Sheets feed.
Alerts: email, Slack, Discord and per-client routing
Critical drops alert you straight away. Everything else arrives in one daily or weekly digest across all your sites, so you're not buried in emails.
1Settings → Alerts: turn email alerts on or off and choose instant, daily or weekly.
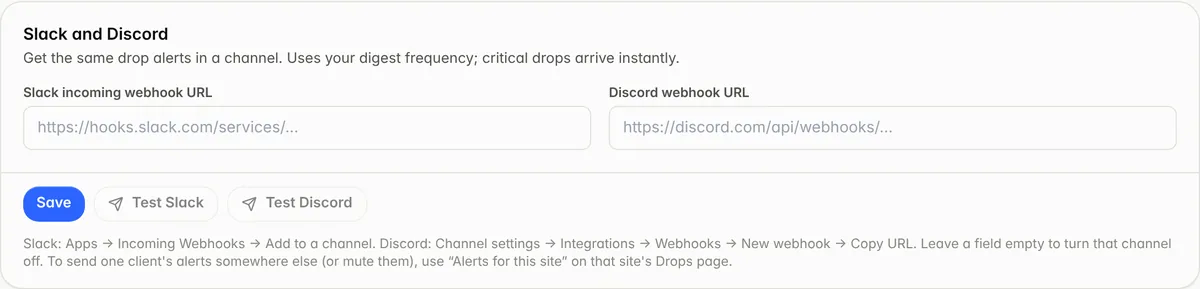
2Settings → Slack and Discord: paste an incoming webhook URL and send a test.
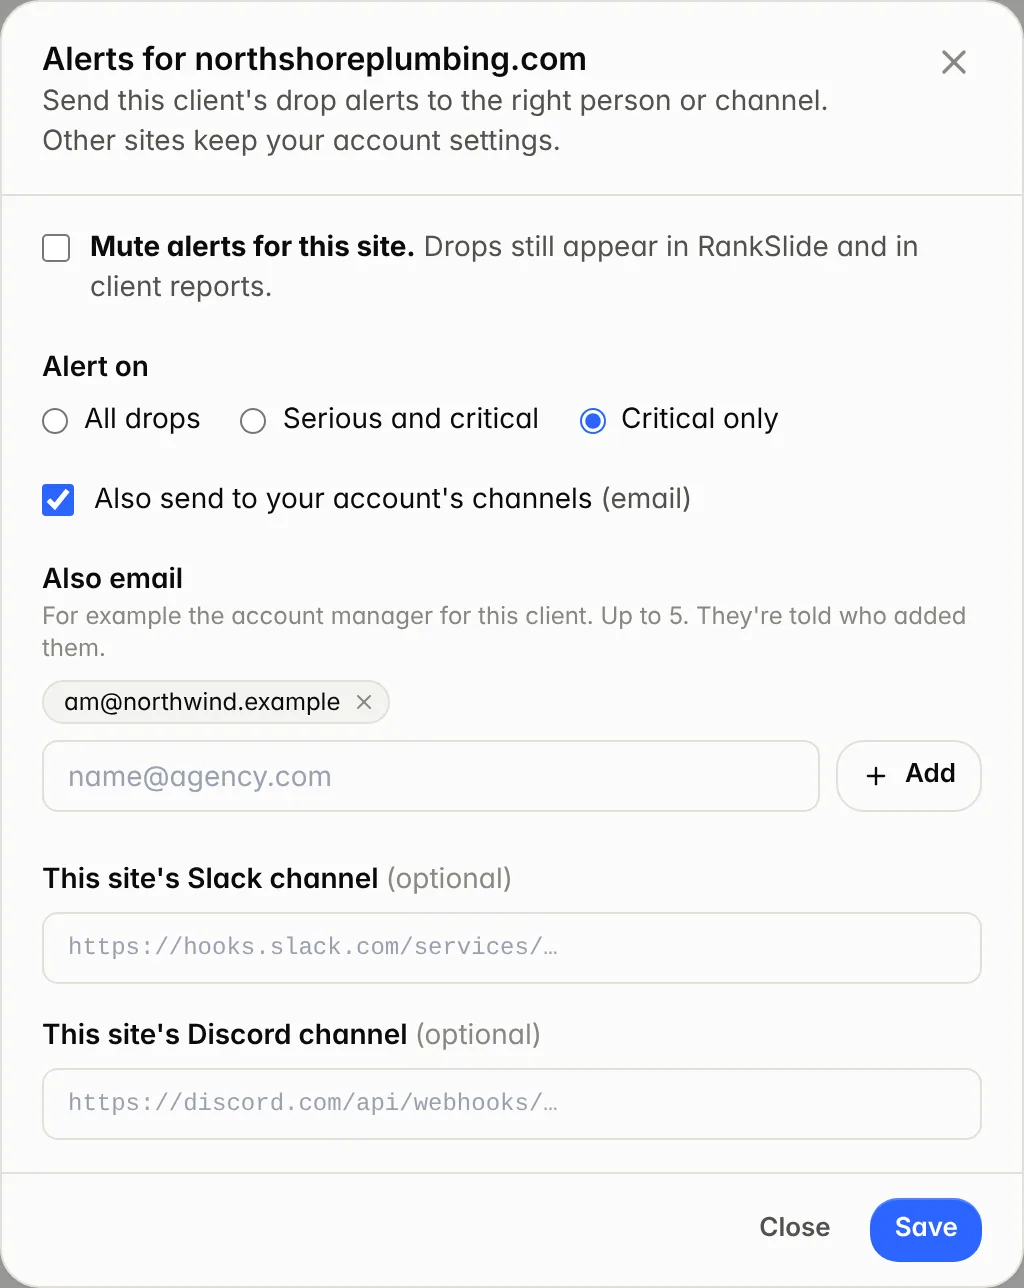
3For one client, open its Drops page and click Change on Alerts for this site: send its alerts to its account manager or its own Slack channel, only alert from Serious or Critical, or mute it.
Per-client routing, set on each site's Drops page.
Client reporting
White-label reports that write and send themselves, with the commentary clients actually read.
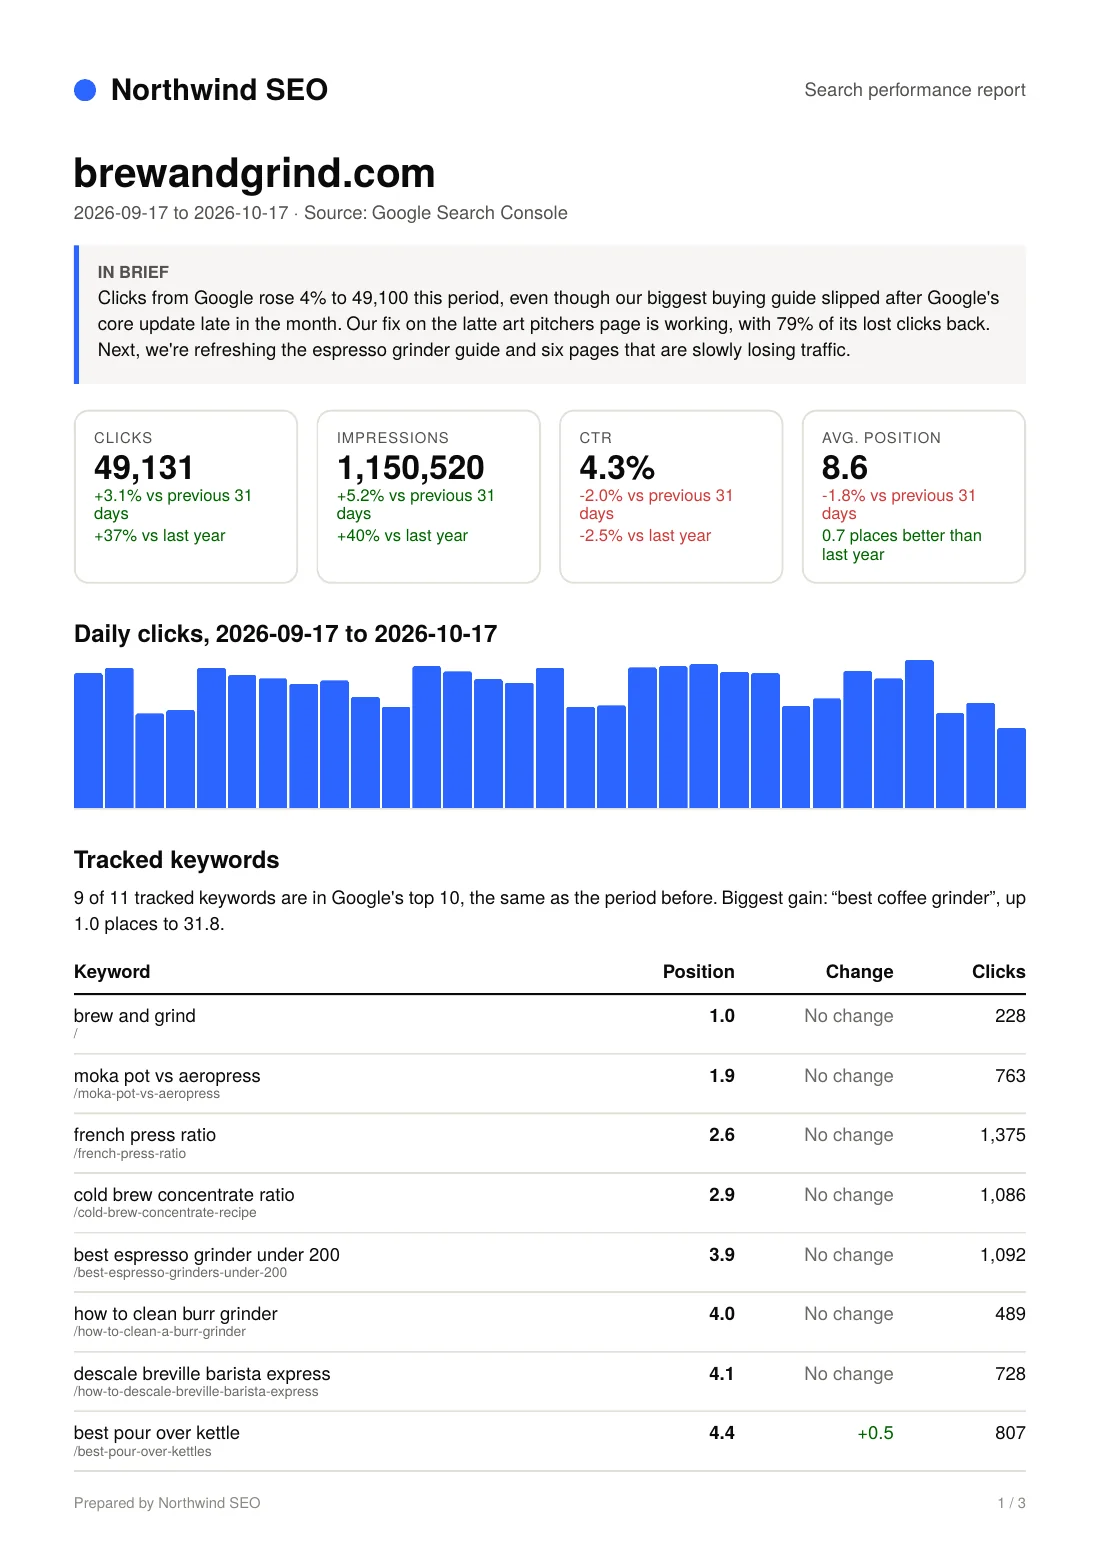
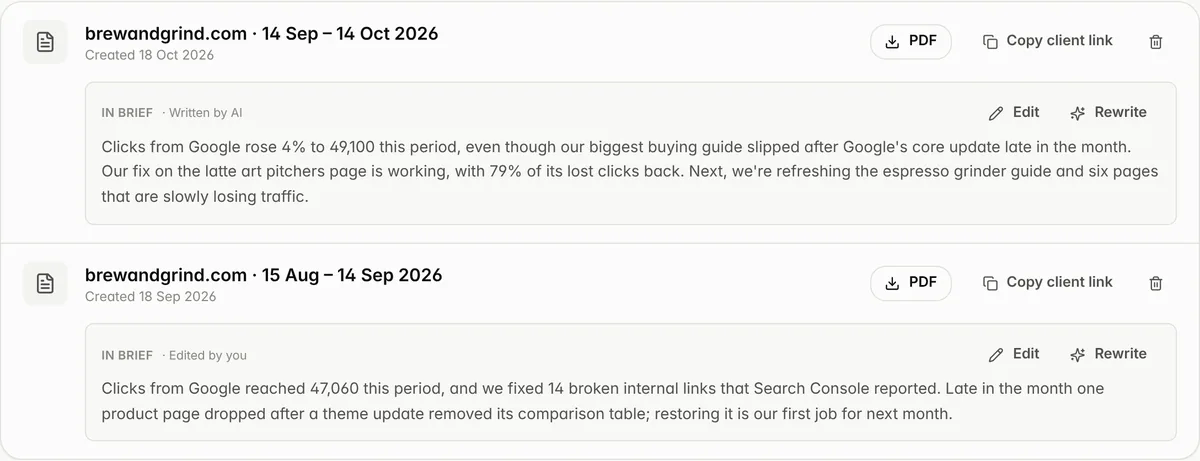
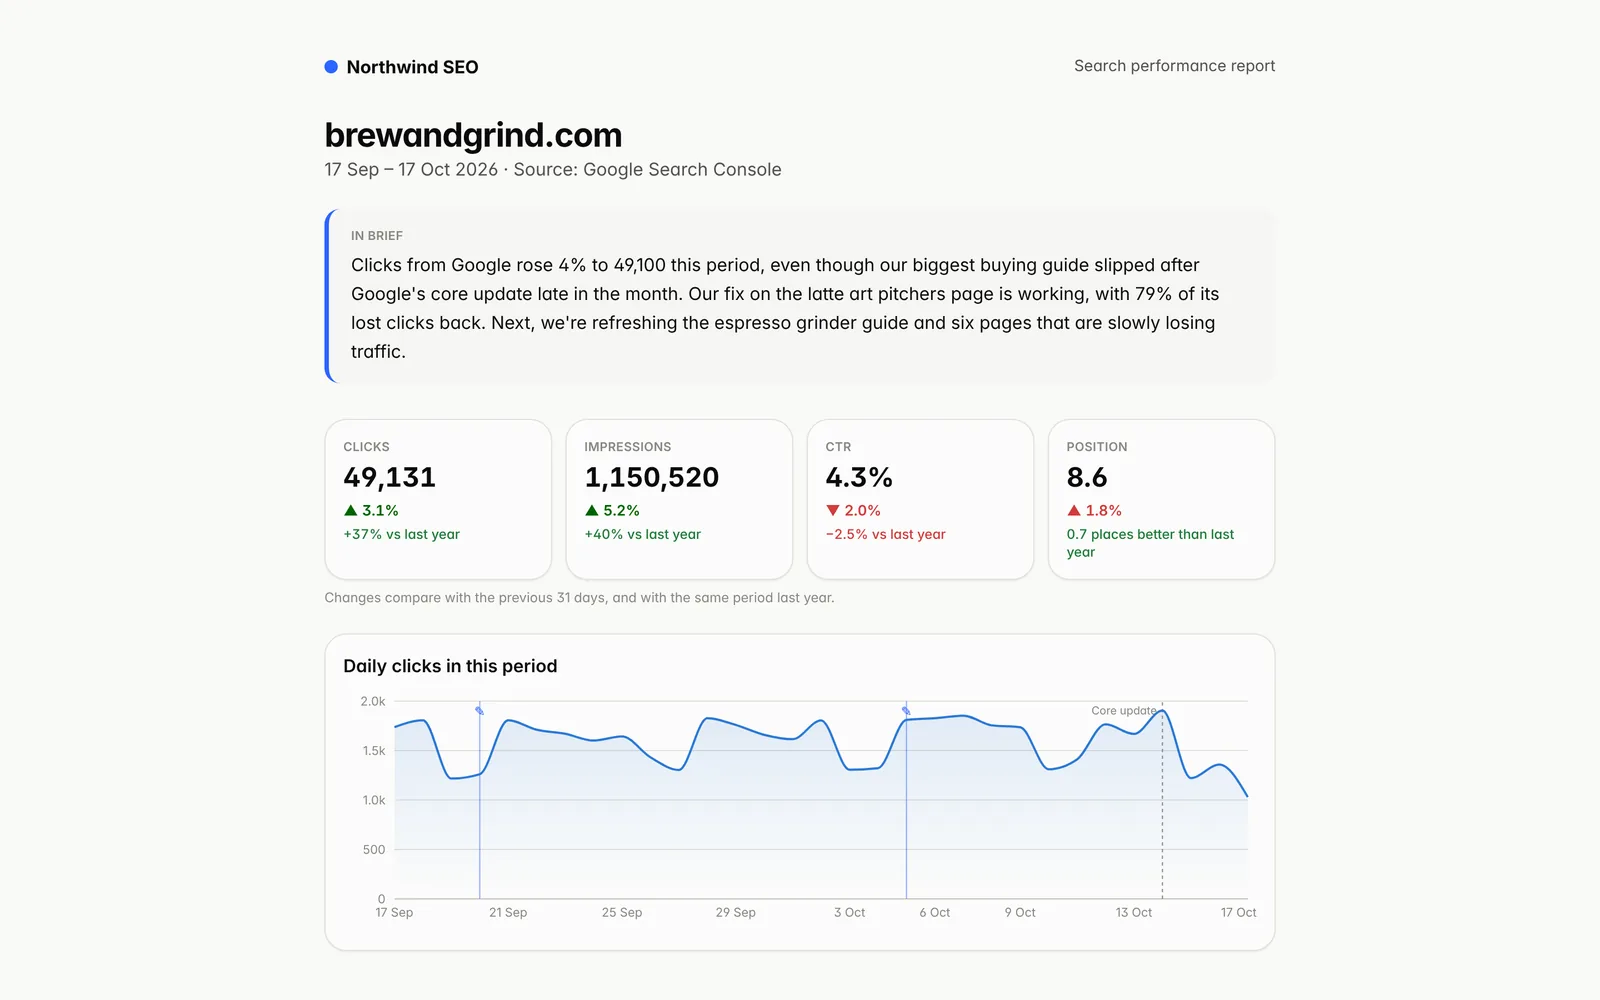
Create a report for last month or the last 30 days. Each one has a branded PDF and a private page you can share: headline numbers against the previous period and the same period last year, the daily chart, tracked keywords, every drop with its cause and fixes, results of your fixes, your work, Google index status, decaying pages and next opportunities.
The PDF carries only your agency's name, colour and logo.
Copy client link gives the private online version; deleting the report turns the link off.
Every report opens with two or three sentences on what moved, why and what's next, written for a client who won't read the rest. It appears at the top of the PDF, the email and the report page.
Click Edit to write your own, or Rewrite for a fresh version. Your edits are kept.
It's written from the report's own numbers, so it never contradicts them.
Choose what each report includes, and next month's plan
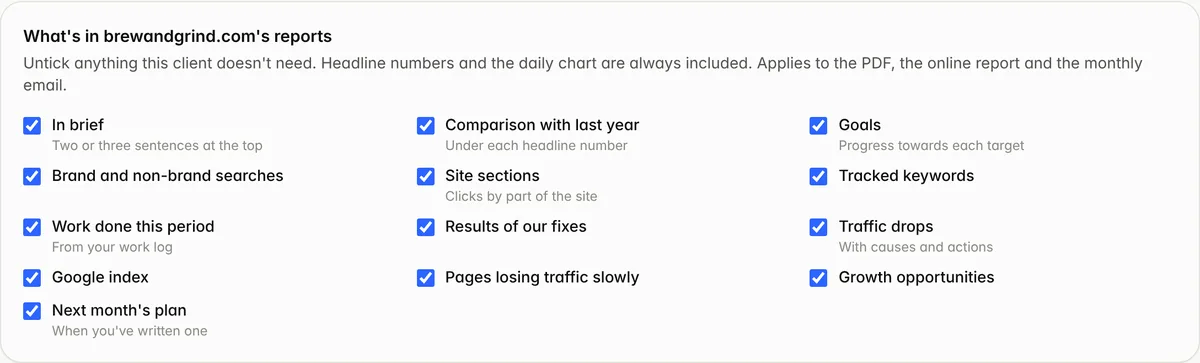
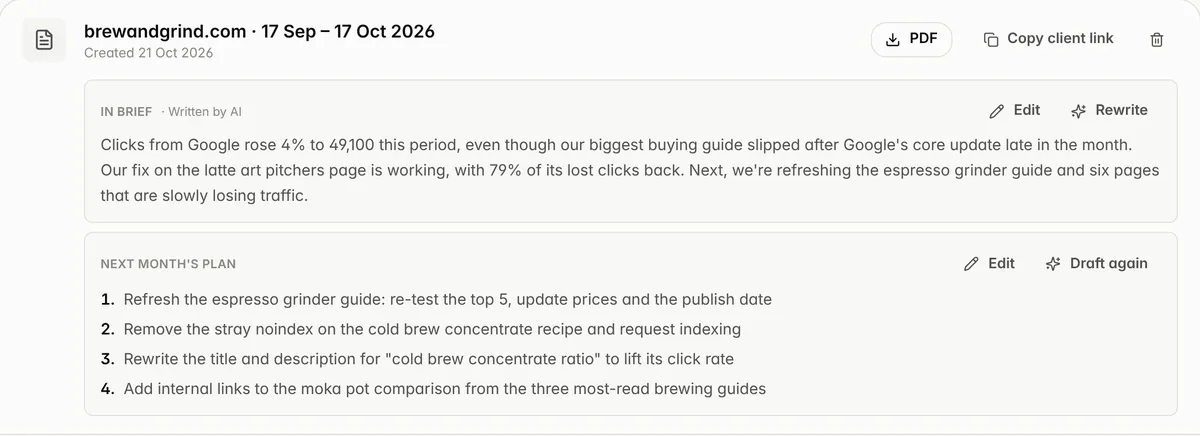
Every client is different: one wants the full picture, another only the headline numbers and the keywords. Choose the sections per site, and end each report with what you'll do next month.
On the Reports page, untick any section under “What's in this site's reports”: In brief, comparison with last year, goals, brand and non-brand, site sections, tracked keywords, work done, results of fixes, drops, Google index, decaying pages, opportunities or the plan. Headline numbers and the daily chart are always included.
The choice applies to the PDF, the online report and the monthly email, and the In brief summary doesn't mention a section you've left out.
Next month's plan: open Write on any report, one item per line, up to 8. It goes near the end of the PDF and the online report, in the email, and into the In brief summary.
Draft it for me starts the plan from the report's own findings (open drops, pages missing from Google's index, keywords that slipped, the best opportunities, pages to refresh), for you to edit.
With review before send turned on, write the plan while the month's report waits for your approval.
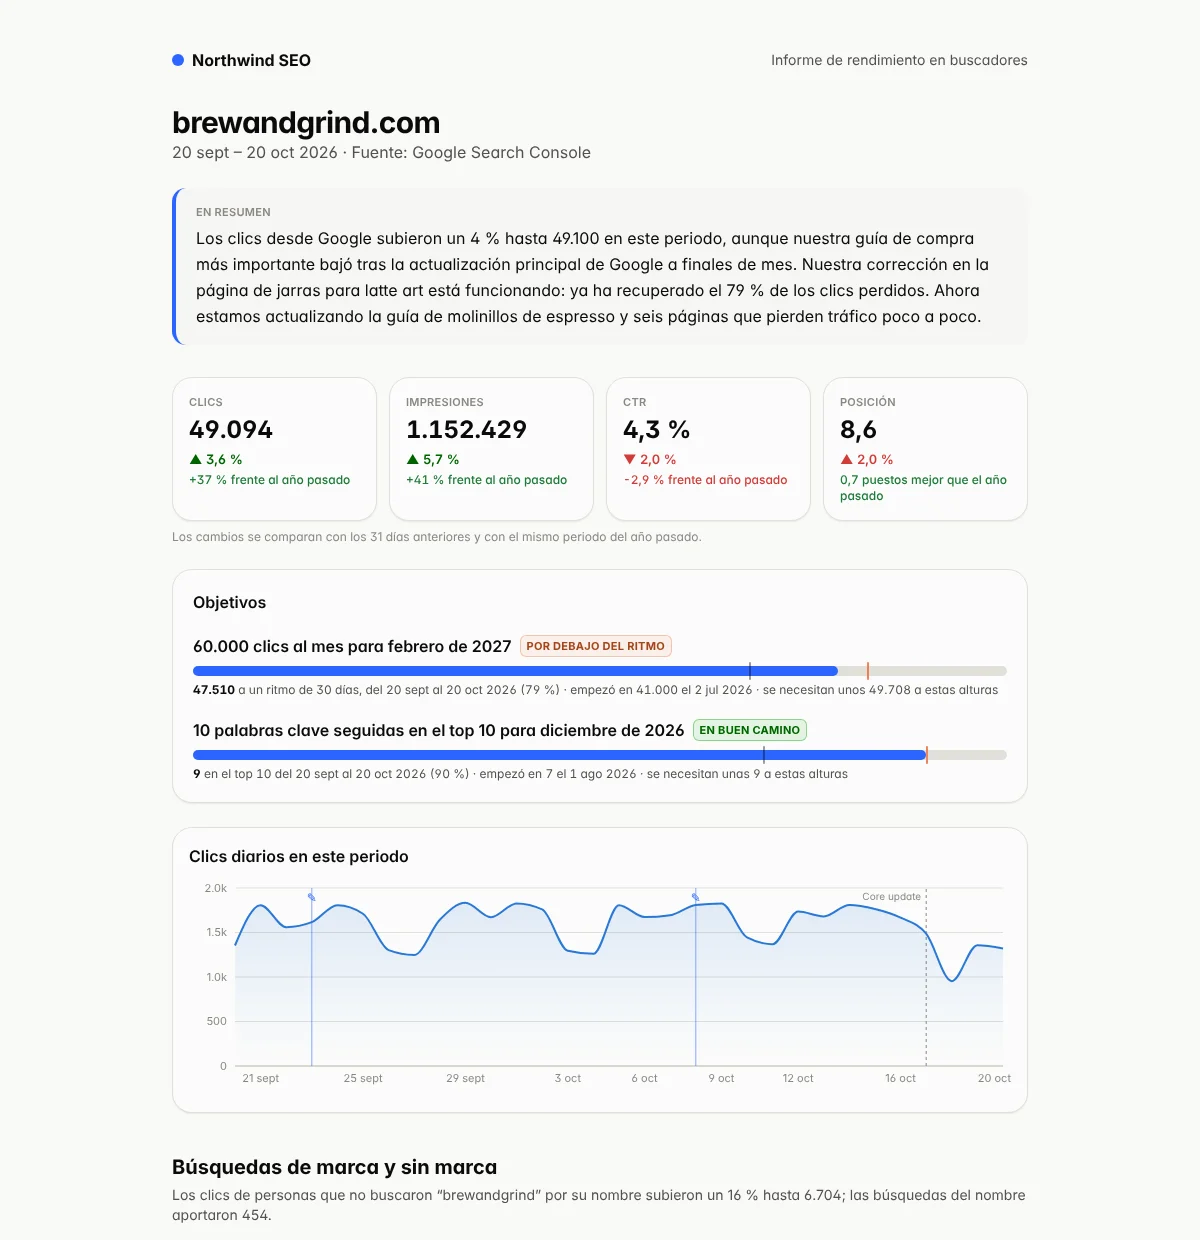
Choose a language for each site and everything that site's client sees is in it: the PDF, the online report, the monthly email, the live dashboard and the unsubscribe page. Choose from English, Spanish, French, German, Portuguese (Brazil), Italian, Dutch, Swedish, Danish and Norwegian.
On the Reports page, pick Report language. For a client with several sites, pick it on the Clients page: it applies to the combined report and email.
Headings and labels are translated by hand, and numbers and dates are written the local way (12.345 clics, 3,9 %, 14 sept.).
Sentences built from the data, like a drop's likely cause or what happened to the tracked keywords, are translated by AI before the report goes out. Every number, search term and page path stays exactly as it was; a sentence that can't be translated safely stays in English.
“In brief” is written in the language from the start, and “Draft it for me” drafts next month's plan in it. A summary written before you changed the language is translated.
Your own work log, notes and plan appear as you write them, so write them in the client's language.
One-click client updates for a drop are drafted in the site's language too.
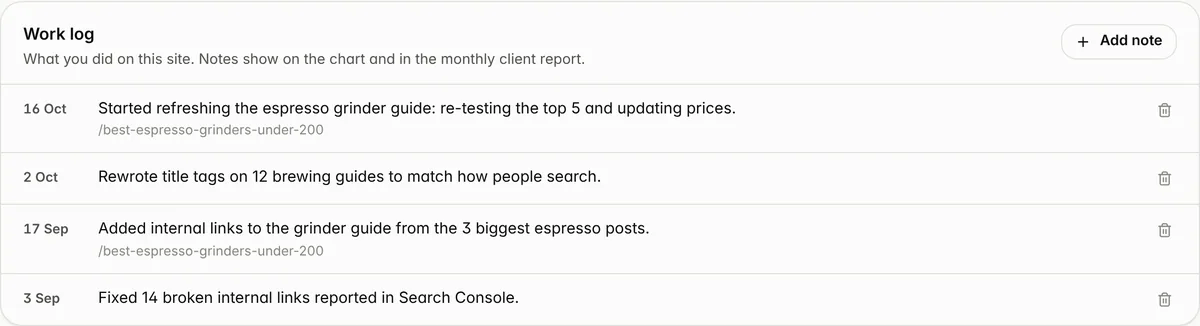
Note what you did on a site and when (new title tags, a refreshed guide, fixed links). Notes are marked on the charts and are listed in the monthly report, so clients see the work next to the results.
Add a note from the Overview page: a date, a short description and, optionally, the page.
The client dashboard can show the work log too (you choose).
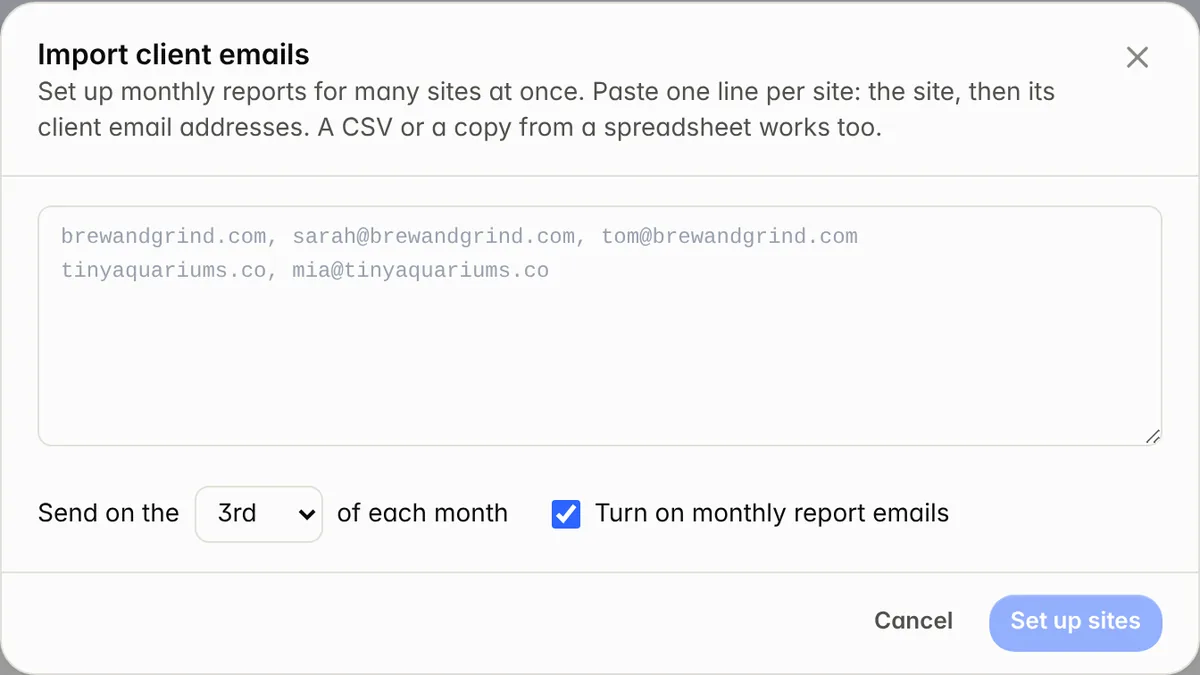
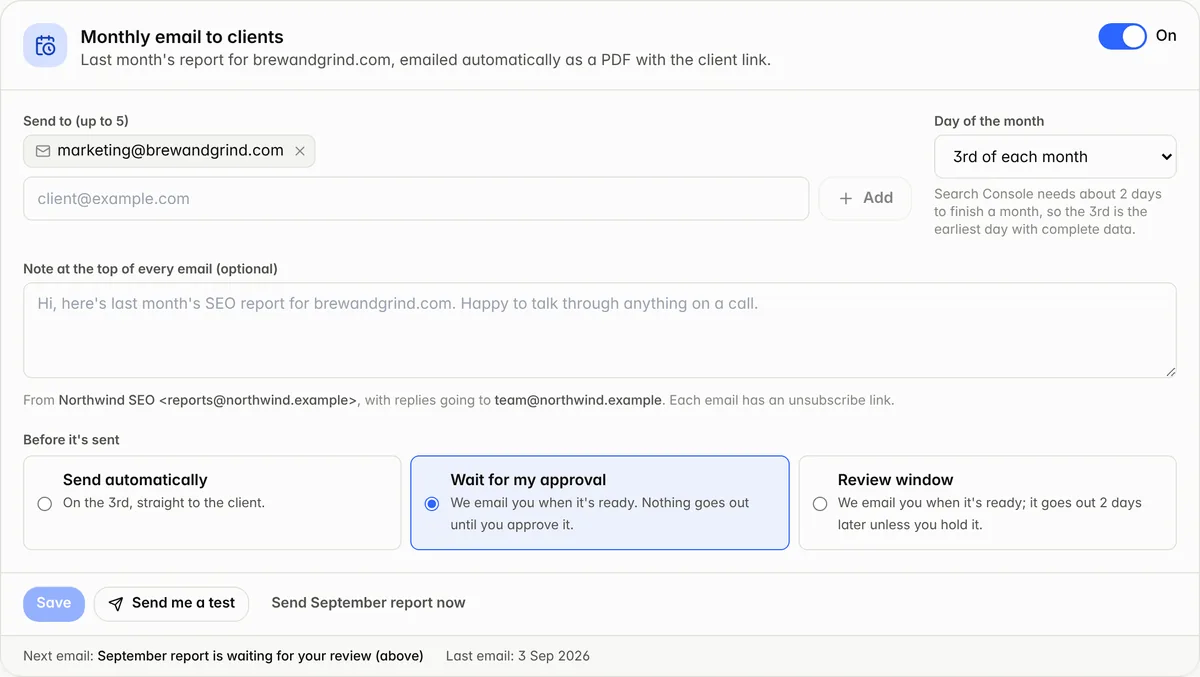
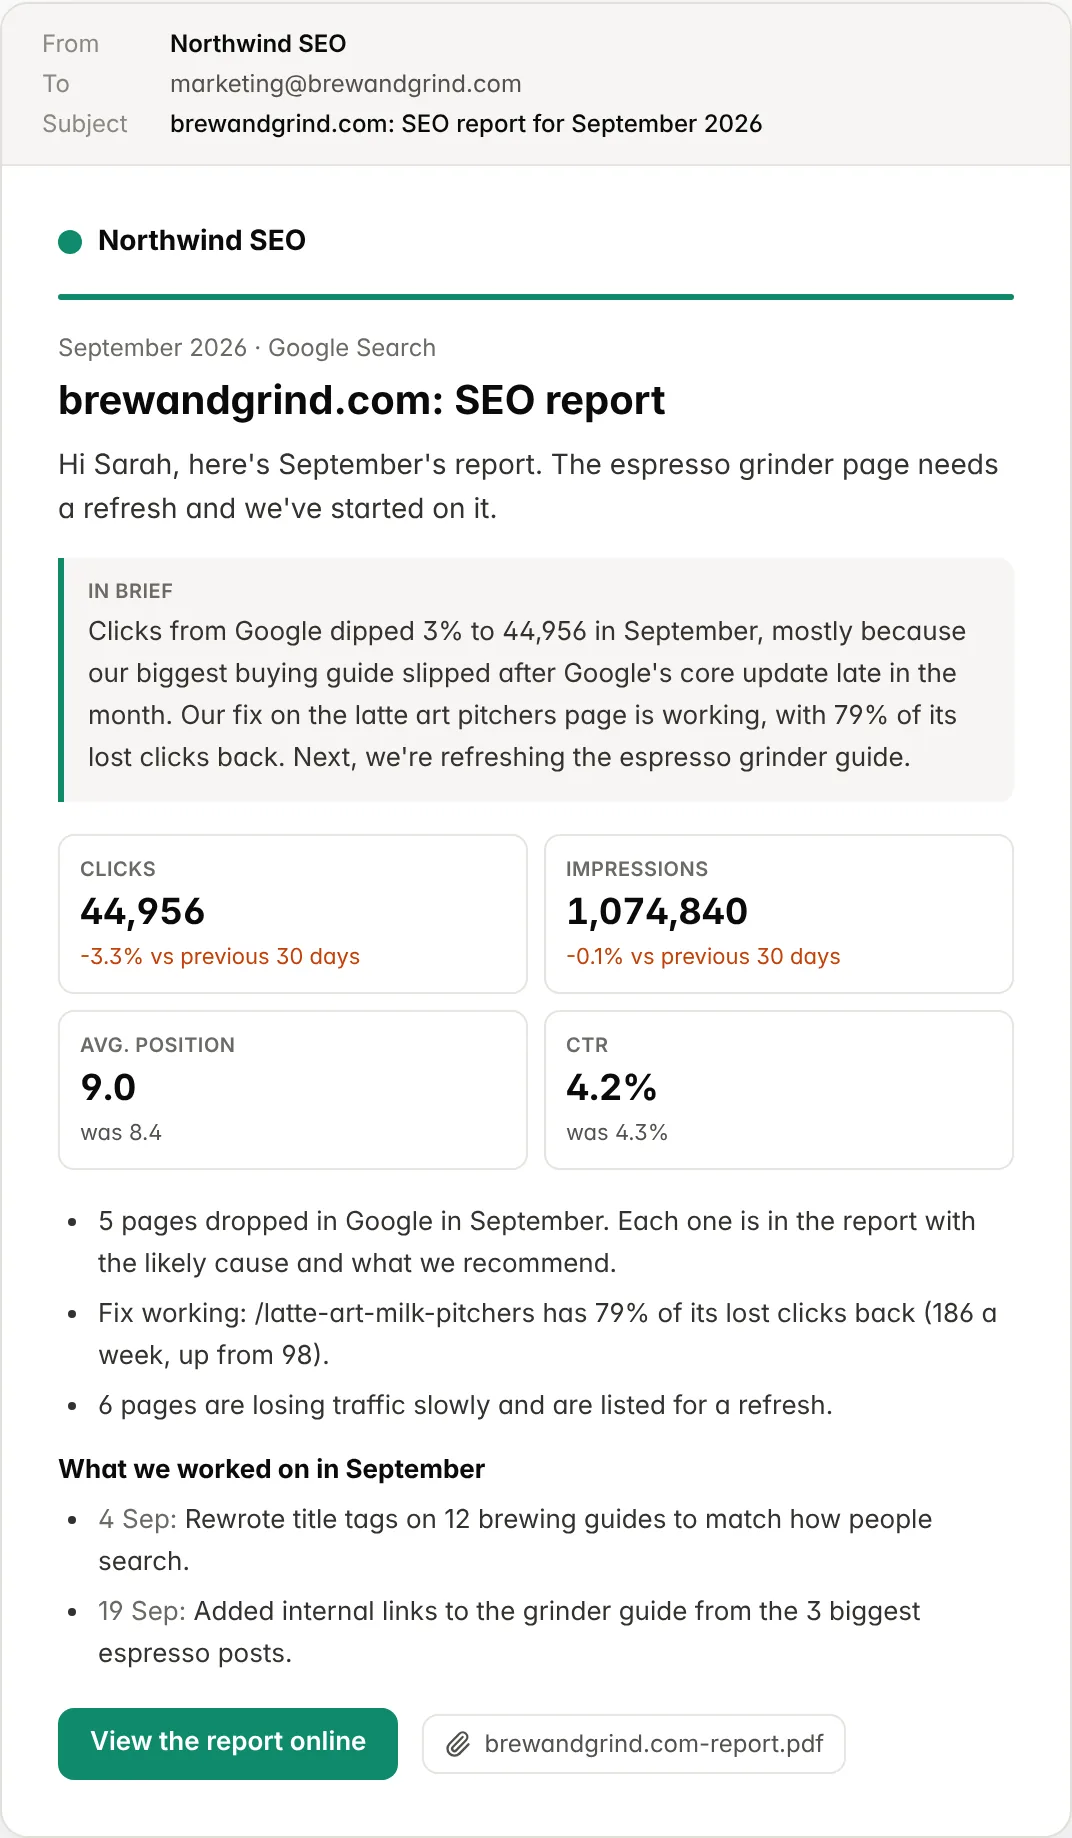
Pick a day of the month and add up to 5 client addresses per site. On that day RankSlide creates last month's report and emails it: the key numbers, the summary, findings, your work, the PDF attached and a link to the online version.
1On the Reports page, turn on Monthly email to clients.
2Add the recipients, pick the day (the 3rd is the earliest with complete data) and, if you like, a note for the top of every email.
3Click Send me a test to see exactly what clients get, then Save.
Replies go to you, and every email has an unsubscribe link.
Send … report now sends this month's straight away.
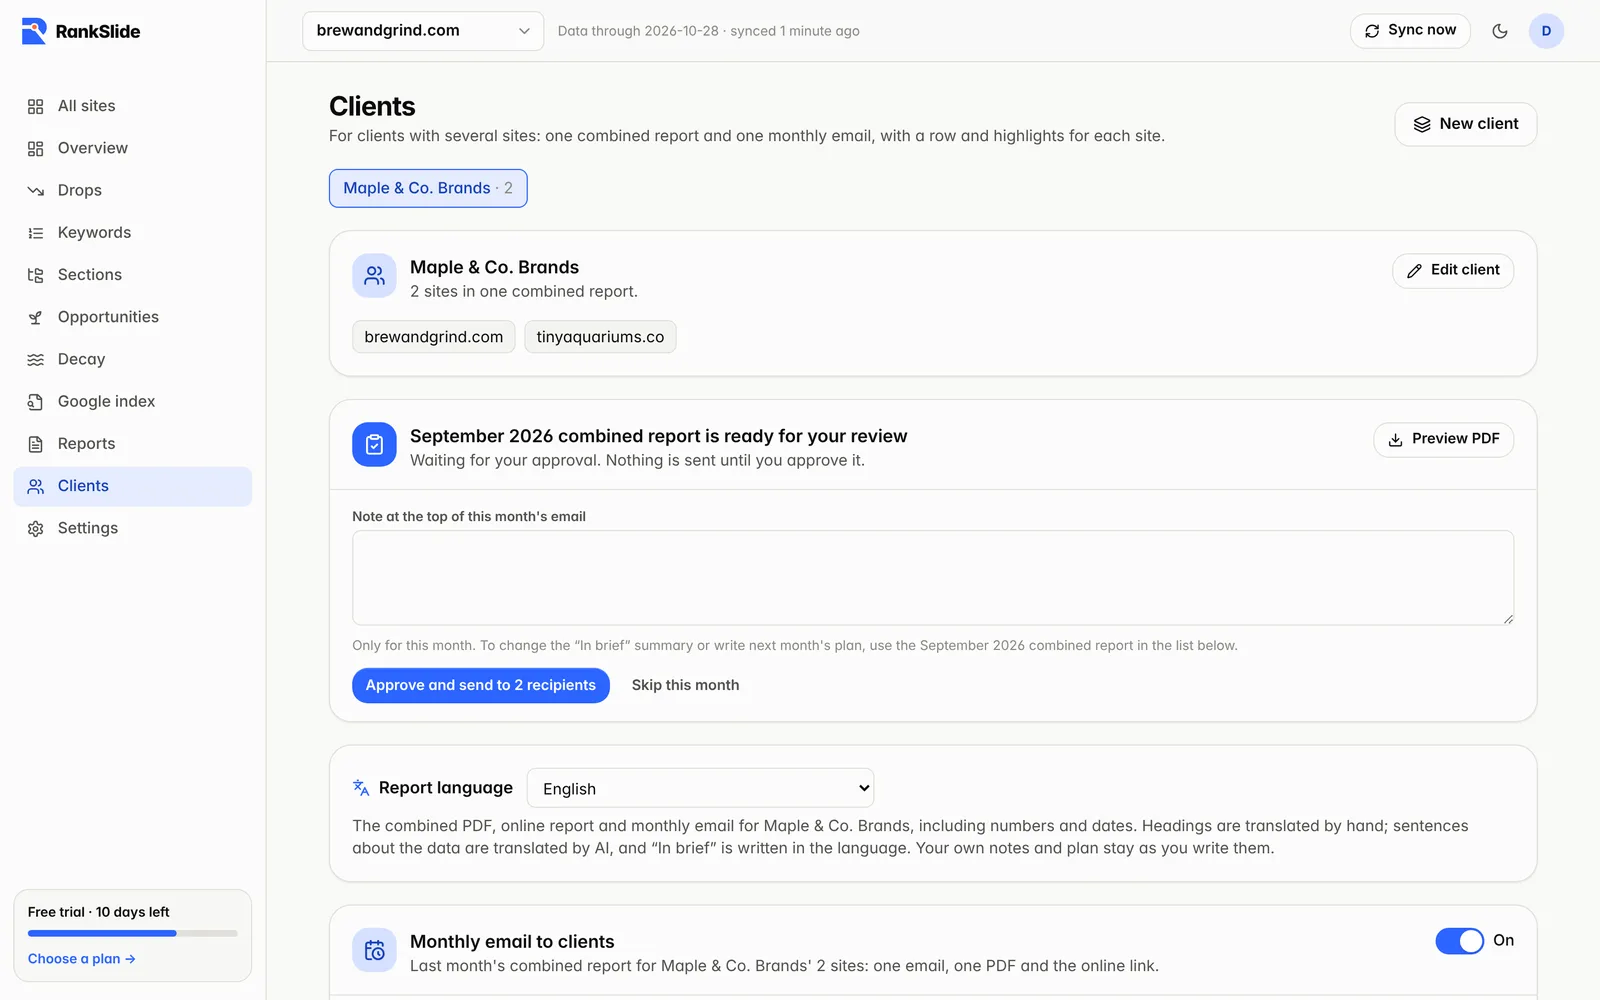
When one client owns several sites, group them on the Clients page and send one report instead of one per site. The combined report adds the sites' numbers together, has a row for each site, a few highlights per site, everyone's work log and one plan for next month.
1Open Clients (in the sidebar, or from the Reports and All sites pages) and click New client.
2Name the client and tick its sites. A site belongs to one client at a time.
3Turn on the monthly email, add up to 5 recipients, pick the day and whether you review it before it's sent, or create a combined report by hand for last month or the last 30 days.
Each site keeps its own settings: the sections you left out for a site stay out of its part of the combined report.
The In brief summary covers the whole client and names the sites that grew or fell most. “Draft it for me” builds next month's plan from each site's most important items, labelled with the site.
Every combined report has its own PDF and share link. The email has an unsubscribe link, and replies go to you.
Sites paused by your plan's site limit are left out. Single-site reports and emails keep working alongside, so turn off a site's own email if the client should only get the combined one.
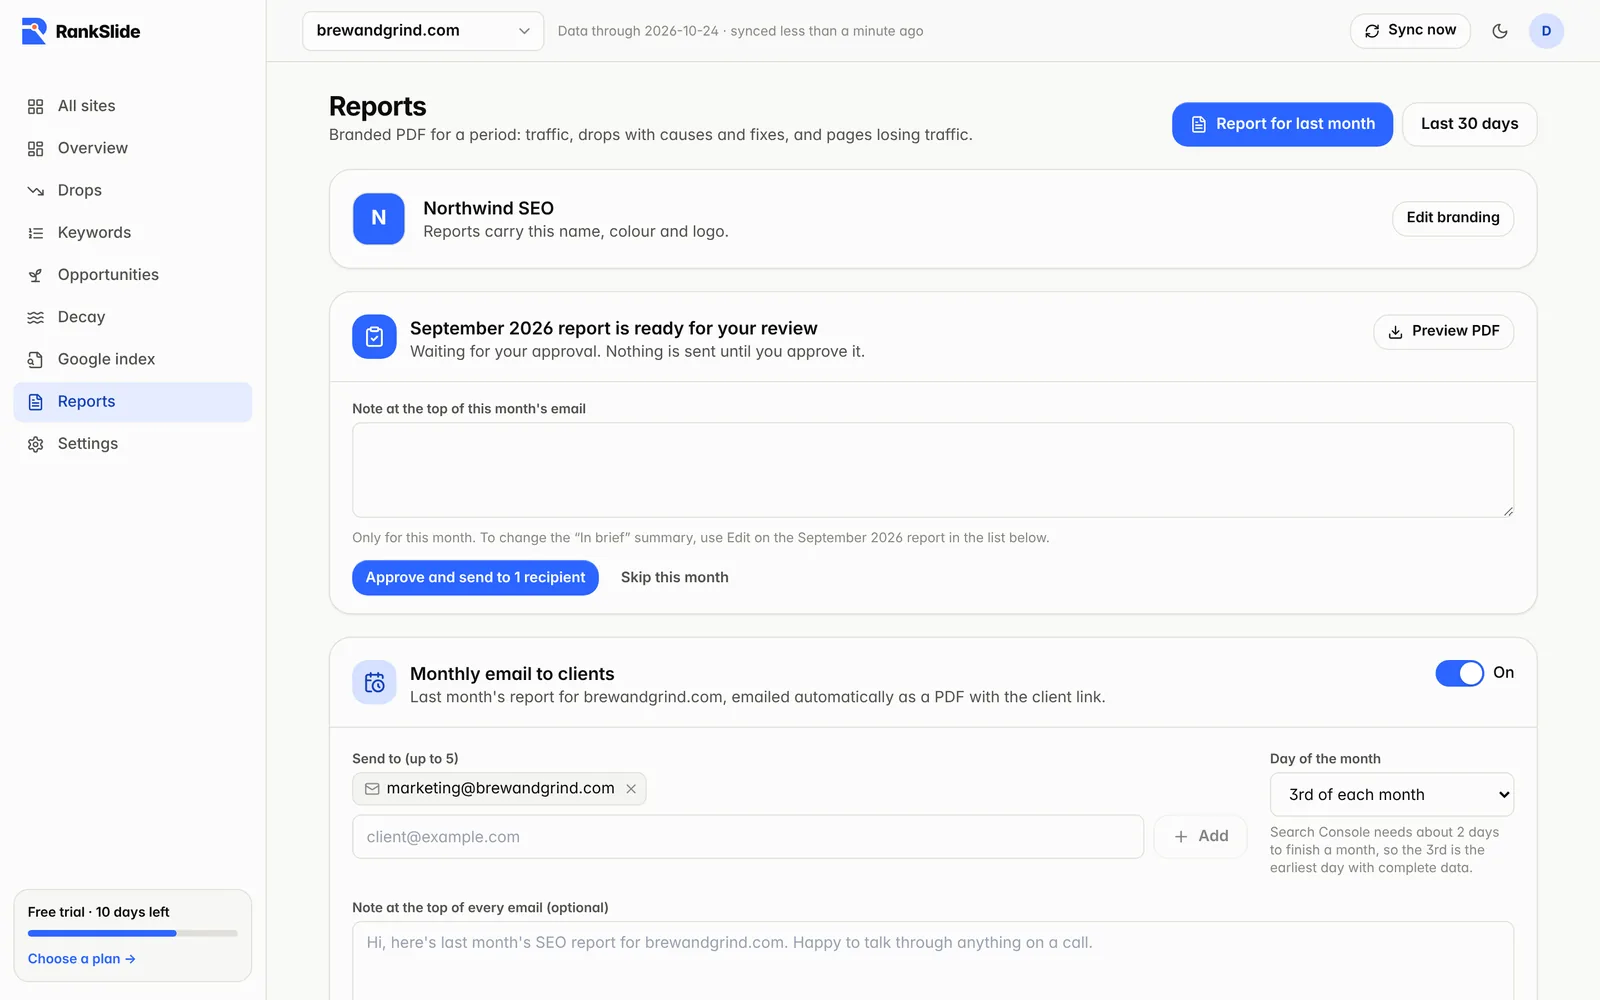
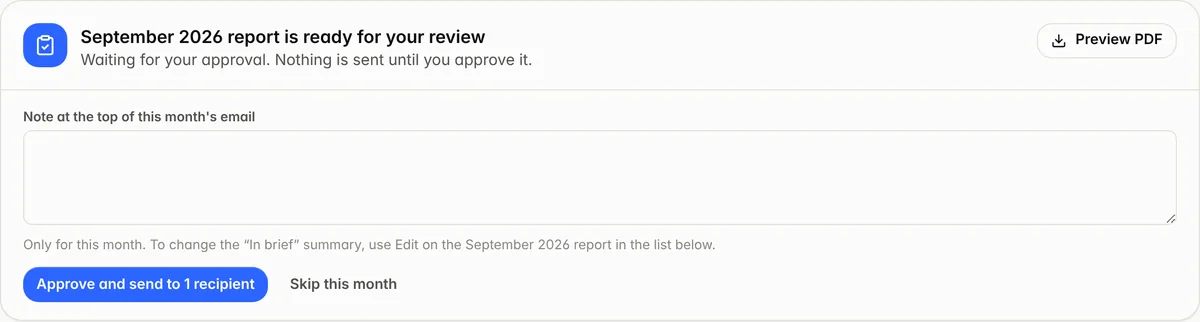
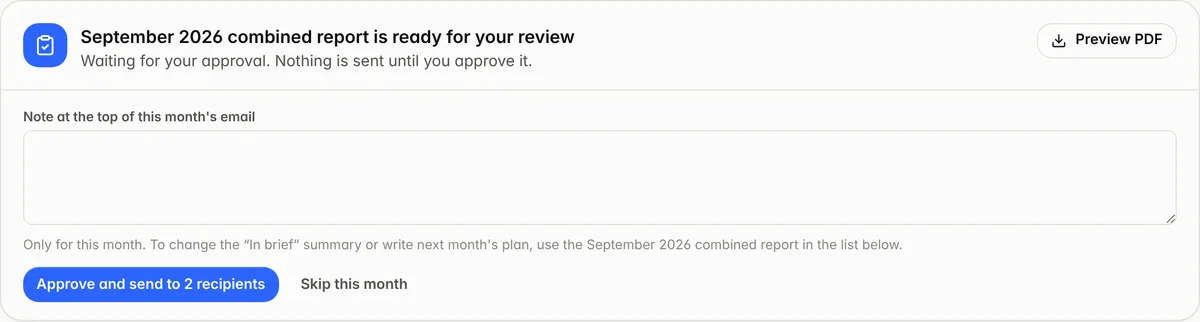
Choose per site, and per client for combined reports: send automatically, wait for your approval, or send 2 days later unless you hold it. With review on, the report is prepared on the send day and you get an email asking you to check it.
Preview the PDF, change this month's note, or edit the summary and plan, then Approve and send.
Skip this month if there's nothing to send; Hold pauses a review-window report.
For a client with several sites, set it under the client's monthly email on the Clients page; the combined report waits for you there.
Reports waiting for you, single-site and combined, are flagged on All sites. You get one email a day listing them all, and one reminder after 3 days.
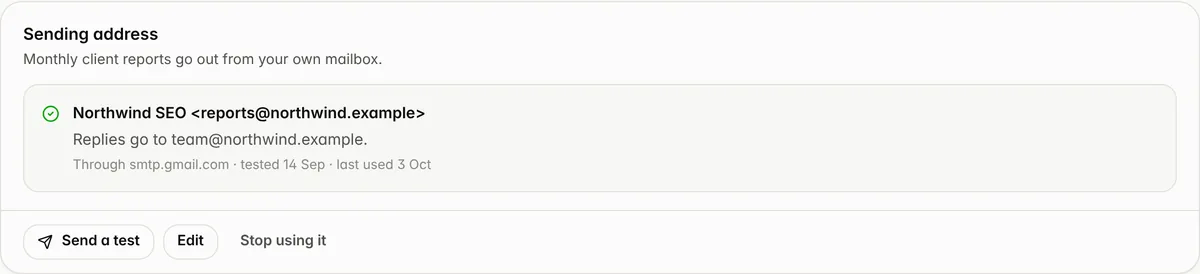
Connect your mailbox and monthly reports come from your own address, like reports@youragency.com, instead of RankSlide's.
1Settings → Sending address → Use my own address.
2Pick your provider (Google Workspace or Gmail, Microsoft 365, Zoho, or any SMTP server) and enter the address and login. Gmail needs an app password.
3Click Send a test and save. The settings are saved only if the test email reaches you.
The password is stored encrypted and used only to send your reports.
If your mailbox ever stops working, reports go out from RankSlide's address with your agency name, so clients still get them, and you get an email saying what to fix.
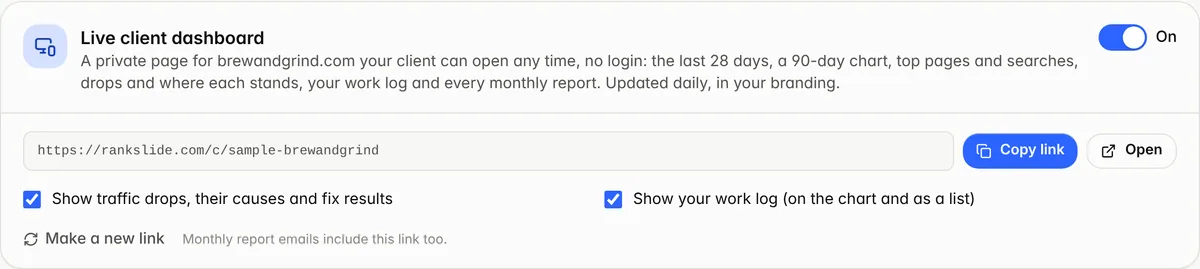
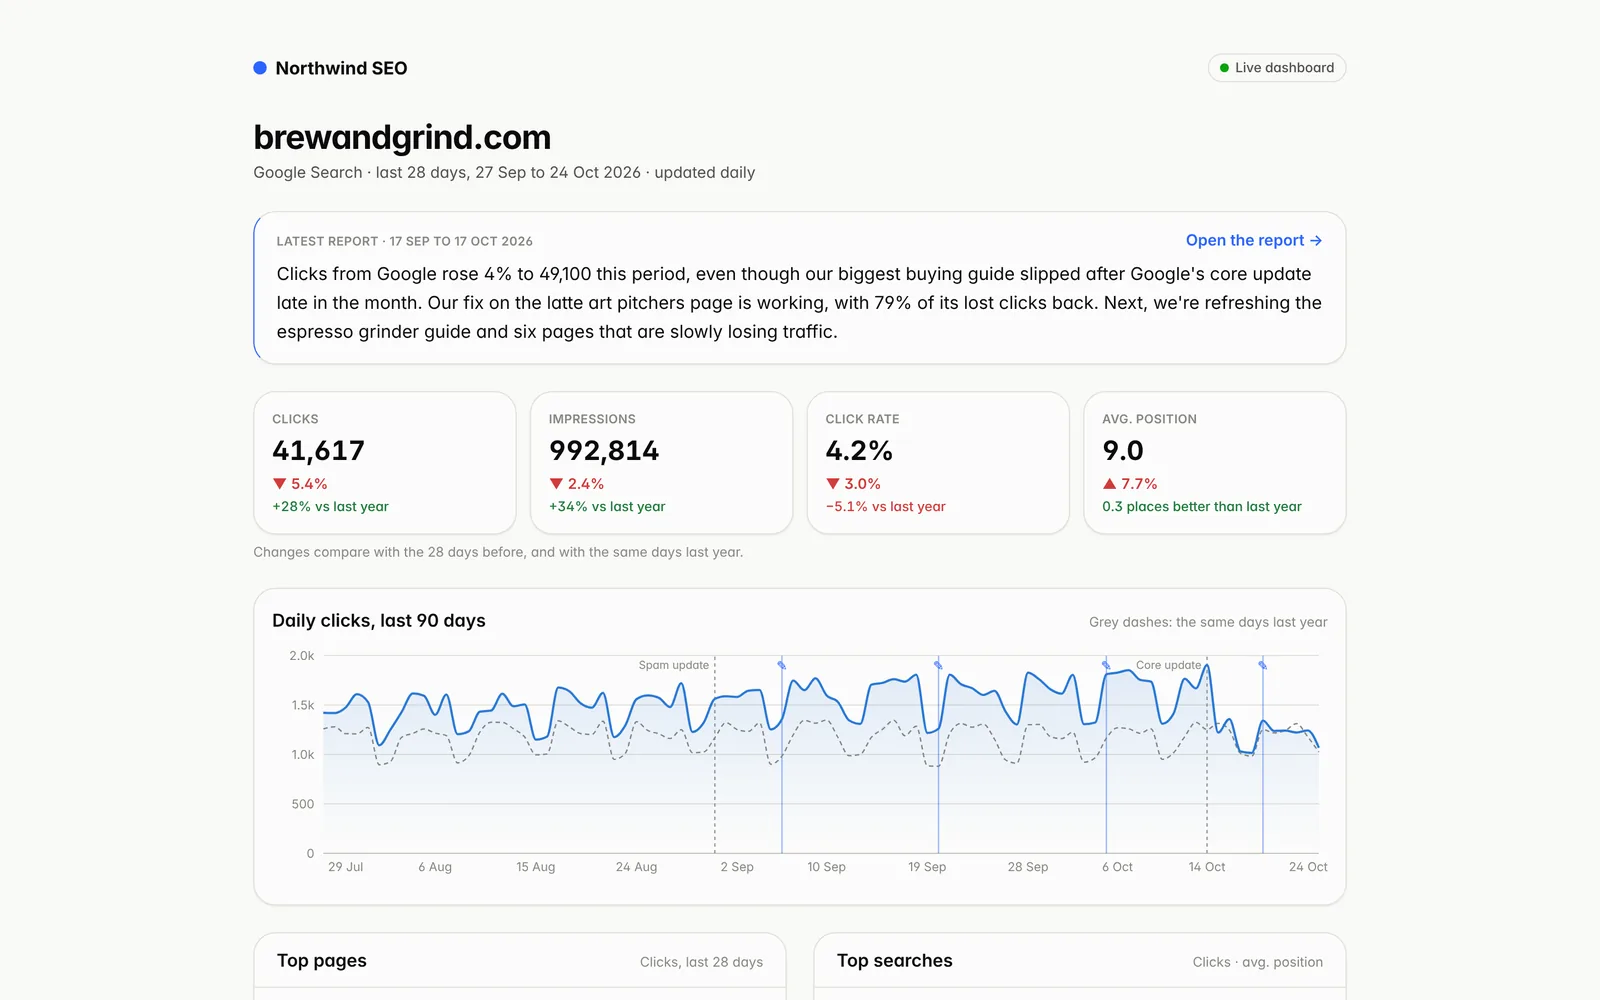
Give a client one private link to their own dashboard: the last 28 days against the 28 before, a 90-day chart, top pages and searches, drops and where each stands, your work log and every monthly report. Updated daily, in your branding.
Turn it on per site on the Reports page. You choose whether drops and the work log show.
Make a new link at any time; the old one stops working. The monthly email includes the link.
What your client sees.
The online report page
Every report has a private page the client can open on any device and forward. It's the same report as the PDF, in your branding, and isn't indexed by search engines.
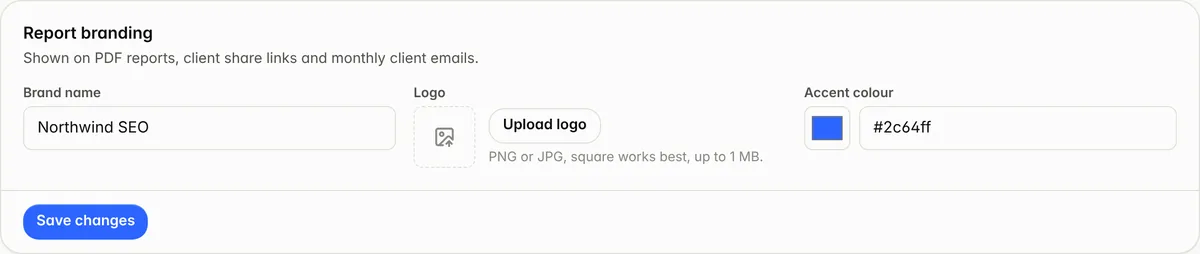
Set your agency name, logo (PNG or JPG, up to 1 MB) and accent colour in Settings → Report branding. They're used on PDFs, report pages, client dashboards, connect links and monthly emails.
Team and data
Work as a team, and take your data wherever else you need it.
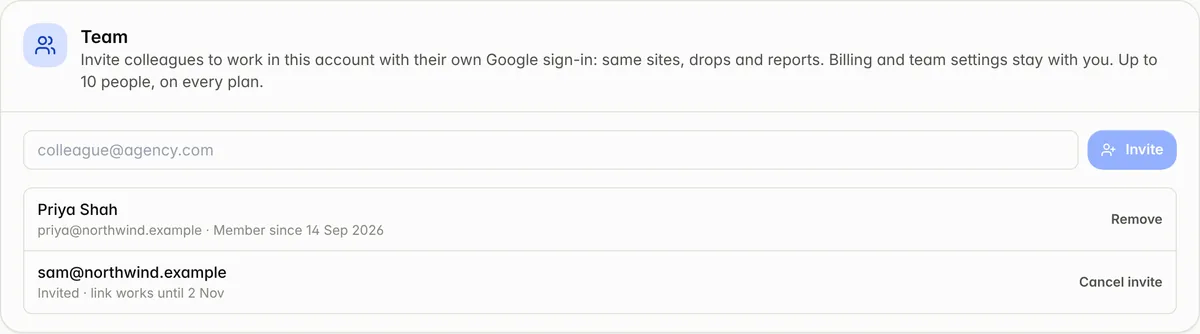
Invite up to 10 colleagues from Settings → Team. Each signs in with their own Google account and works in your account: the same client sites, drops and reports.
Billing, team and account settings stay with you, the owner.
Invites go to one email address and work for 14 days. Remove anyone at any time.
CSV export, Google Sheets, Looker Studio and webhooks
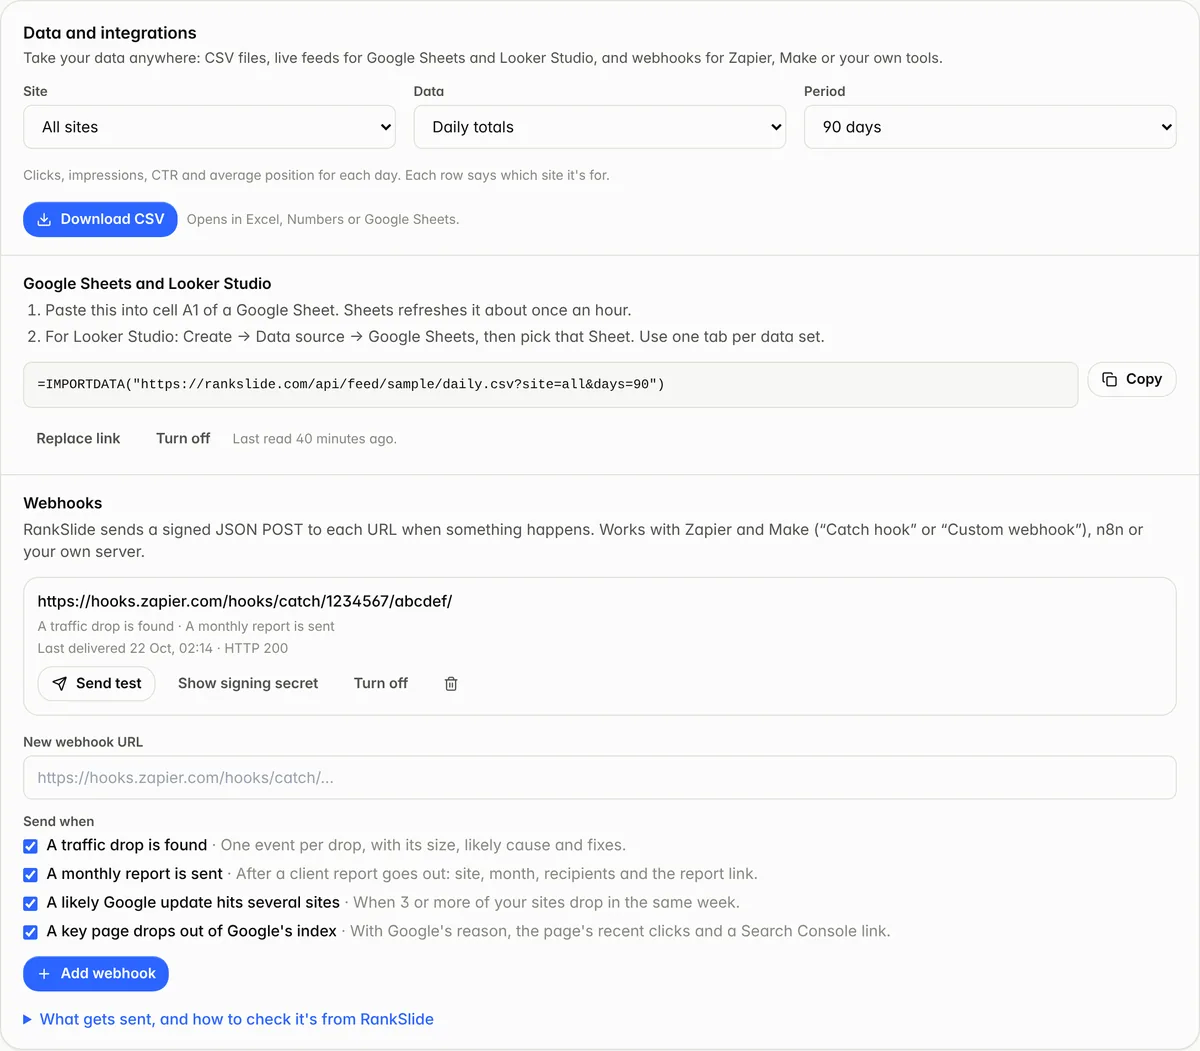
Settings → Data and integrations, plus an Export CSV button on Overview, Drops, Opportunities and All sites.
CSV: daily totals, top 1,000 pages, top 1,000 searches, drops, opportunities, the work log or an all-sites summary, for one site or all, for 7 days up to 16 months.
Google Sheets and Looker Studio: turn on live feeds and paste the formula into a Google Sheet; it refreshes about hourly, and Looker Studio can chart that Sheet. Replace or turn off the link at any time.
Webhooks: up to 5 HTTPS addresses (Zapier, Make, n8n or your own server) get a signed JSON POST when a drop is found, a report is sent, a likely Google update hits several sites, or a key page drops out of Google's index.
Plans and your data
Which plan do I need?
Every plan has every feature; plans differ only in how many sites they cover: Starter $5/month (1 site), Pro $11 (5 sites), Agency $29 (25 sites), and Scale at $1.15 per site per month for 26 to 100 sites, where you pick the number at checkout. Yearly billing saves 20%. Every plan starts with a 14-day free trial, no card needed.
What happens when the free trial ends?
We email you 4 days before and on the last day, with what you've used so far. Nothing is charged automatically: if you don't pick a plan, syncing, alerts, client emails and shared links stop, but your sites, settings and reports stay saved. Pick a plan later and it carries on, with the days in between filled in from Search Console.
Which emails will RankSlide send me?
Drop alerts (Settings → Alerts), notices about your client reports (approvals, a mailbox that stopped working) and, while you get started, a few setup tips: a welcome, a nudge if no site is connected after two days, a summary after the first check, and the trial reminders. Turn the tips and reminders off with the checkbox in Settings → Alerts or the link at the bottom of any of them.
What happens to sites over my plan's limit?
Your oldest sites up to the limit keep syncing; the rest are paused (shown as Paused on All sites) until you upgrade or remove a site.
What access does RankSlide have?
Read-only Search Console access (webmasters.readonly). It can't change anything in Search Console or on your sites, and you can remove access at any time in your Google Account.
How is my data protected?
Data is encrypted in transit and at rest, Google tokens, mailbox passwords and webhook secrets never reach the browser, and every table is locked to your account. Search data is kept for up to 16 months. See the privacy policy for details.